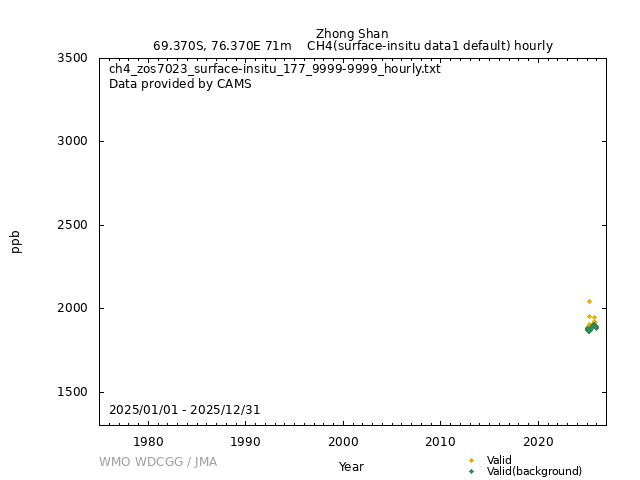
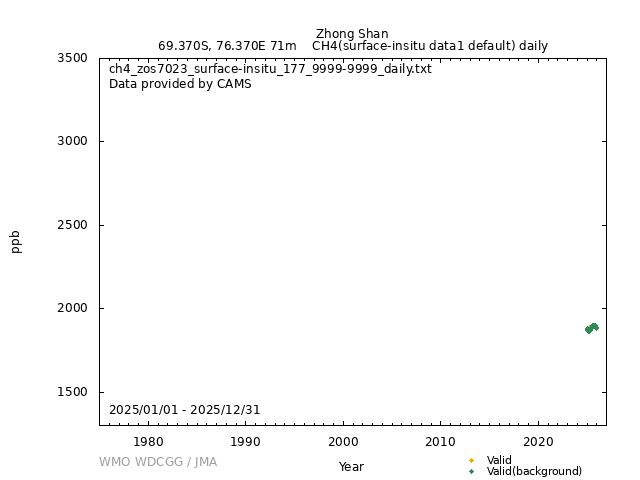
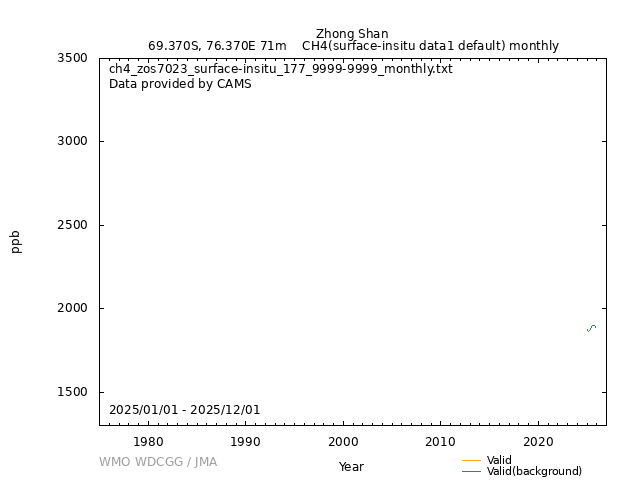
Data Policy
GAW Data Policy
"For Scientific purposes, access to these data is unlimited and provided without charge.
By their use you accept that an offer of co-authorship will be made through personal contact with the data providers
or owners whenever substantial use is made of their data.
In all cases, an acknowledgement must be made to the data providers or owners and to the data centre when these data are used within a publication."
Version
2026-08-18-0739 (Last updated: 2026-08-21)File
This data set is submitted by CAMS.
In line with the GAW Data Policy, users should contact the contributors of all data of interest and propose co-authorship or acknowledgement.
Organization
| NO | 177 |
|---|---|
| Acronym | CAMS |
| Name | Chinese Academy of Meteorological Sciences |
| Address 1 | No.46 South Zhongguancun Street |
| Address 2 | Haidian District |
| Address 3 | Beijing |
| Country/Territory | China |
| Website | https://www.camscma.cn/En |
Contact(s)
| Name | Shoudong Zhao |
|---|---|
| Prefix | Dr. |
| shoudongzhao@outlook.com | |
| Organization No | 177 |
| Organization acronym | CAMS |
| Organization name | Chinese Academy of Meteorological Sciences |
| Organization country/territory | China |
| Address 1 | No.46 South Zhongguancun Street |
| Address 2 | Haidian District |
| Address 3 | Beijing |
| Country/territory | China |
| Tel | |
| Fax | |
| Last updated date | 2026-08-18 |
| Name | Kongju Zhu |
|---|---|
| Prefix | |
| zhukj@cma.gov.cn | |
| Organization No | 177 |
| Organization acronym | CAMS |
| Organization name | Chinese Academy of Meteorological Sciences |
| Organization country/territory | China |
| Address 1 | No.46 South Zhongguancun Street |
| Address 2 | Haidian District |
| Address 3 | Beijing |
| Country/territory | China |
| Tel | |
| Fax | |
| Last updated date | 2026-08-18 |
| Background observation | |
| UTC | |
| ppb | |
|
9999-12-31 00:00:00 - 9999-12-31 23:59:59: WMO CH4 X2004A |
|
|
2024-01-01 00:25:00 - 9999-12-31 23:59:59: Picarro G2301(CRDS) |
|
|
9999-12-31 00:00:00 - 9999-12-31 23:59:59: 4 (m) |
|
| Unknown | |
|
Seasonal calibration is conducted once every three months. During calibration, the low (WL), medium (WM), and high (WH) standard gases are introduced sequentially. Each cylinder is measured continuously for 15 minutes, and the procedure is repeated for three consecutive rounds (9 measurements in total) to verify the linear response of the instrument. For each reference gas measurement, the mean of the stable measurement segment (excluding the first 2-3 minutes of flushing) is taken as the instrument response value for that cylinder and round. The three-round average yields the instrument measurement mean for each standard gas. A linear regression is performed using the method of least squares, with the real mole fractions of the three standard gases as the dependent variables and the instrument measurement means as the independent variables. For observational data between two consecutive seasonal calibrations, the calibration equation coefficients obtained from the preceding and following calibrations are linearly interpolated in time on a minute-by-minute basis to generate time-varying correction coefficients. The raw instrument measurements are then corrected using these interpolated coefficients to obtain the final CH4 mole fractions. |
|
|
Raw measurements were water-vapor corrected and filtered to retain CH4 concentrations of 0.3–5.9 ppm. The retained data were aggregated to 1-min means, with the within-minute standard deviation and observation count calculated for quality control. Step 1: Completeness. The number of observations per minute was compared with the mean count for the corresponding sampling frequency or year-month period. Minutes containing fewer than half the expected observations were labeled I. Step 2: Data Classification. Ambient, daily-calibration, and seasonal-calibration measurements were separated using the valve-status variable and processed independently. Calibration data were not assigned a separate C flag in the final dataset. Step 3: Instrument Stability. Valid minutes required a temperature SD ≤0.02 °C, mean temperature of 45.00±0.02 °C, pressure SD ≤0.1 Torr, and mean pressure of 140.0±0.1 Torr. Minutes failing any applicable criterion were labeled Q1. Step 4: Precision. Minutes with a CH4 SD ≤0.001 ppm were considered sufficiently precise. Those with an SD of 0.001–0.005 ppm were labeled Q3, while those with an SD >0.005 ppm were labeled I. Only measurements passing the CH4-specific quality criteria were used in subsequent background screening. Step 5: Calibration. Calibration periods were evaluated using rolling 3-min windows. For each sequence, the window with the smallest CH4 SD was selected, and its mean was used as the measured calibration value. Seasonal calibration regressions with R²>0.99 were retained, and their slopes and intercepts were interpolated over time and applied to ambient CH4. Step 6: Background Screening. Background CH4 was identified using a two-pass procedure based on a local 4-h mode. Measurements showing both a substantial departure from this mode and elevated short-term variability were classified as pollution events or low anomalies. These events were removed after the first pass, and the 4-h modal baseline was recalculated for final classification. Step 7: Aggregation. The screened CH4 data were aggregated to hourly, daily, and monthly resolutions. At each resolution, Flag 1 denotes a background value supported by sufficient observations, Flag 2 a valid non-background value, and Flag 3 an invalid or missing value. |
|
|
[Hourly] Hourly values are calculated as the average of minute-level values. [Daily] Daily values are calculated as the average of hourly values. [Monthly] Monthly values are calculated as the average of daily values. |
|
|
Valid (background): 1 Valid: 2 Invalid: 3 |
|
| Operational/Reporting | |
|
Wind direction: Wind speed: Relative humidity: Precipitation amount: Air pressure: Air temperature: Dew point temperature: Sea water temperature: Sea surface water temperature: Sea water salinity: Sea surface water salinity: |
|
|
Meteorological data may remain as first provided, even when greenhouse gas data are updated. |
No DOI available
Related information
| Format | Text (WDCGG Data Format Table, WDCGG Meteorological Data Format Table), NetCDF | ||||
|---|---|---|---|---|---|
| Relation List (Is Part Of) |
All CH4 data contributed to WDCGG by GAW stations and mobiles by 2026-09-24 |
||||
| Geolocation Point |
|
GAW Data Policy
"For Scientific purposes, access to these data is unlimited and provided without charge.
By their use you accept that an offer of co-authorship will be made through personal contact with the data providers
or owners whenever substantial use is made of their data.
In all cases, an acknowledgement must be made to the data providers or owners and to the data centre when these data are used within a publication."
Citation format
This format is an example of the WDCGG standard citation.
Please follow the citation format which the data providers or owners indicate.
Please follow the citation format which the data providers or owners indicate.
Shoudong Zhao (CAMS),
Kongju Zhu (CAMS),
Atmospheric CH4
at Zhong Shan by Chinese Academy of Meteorological Sciences,
dataset published as CH4_ZOS7023_surface-insitu_CAMS_data1 at WDCGG,
ver. 2026-08-18-0739 (Reference date*: YYYY/MM/DD)
* As the reference date, please indicate the date you downloaded the files.
* As the reference date, please indicate the date you downloaded the files.