Now Loading...
Now Loading...
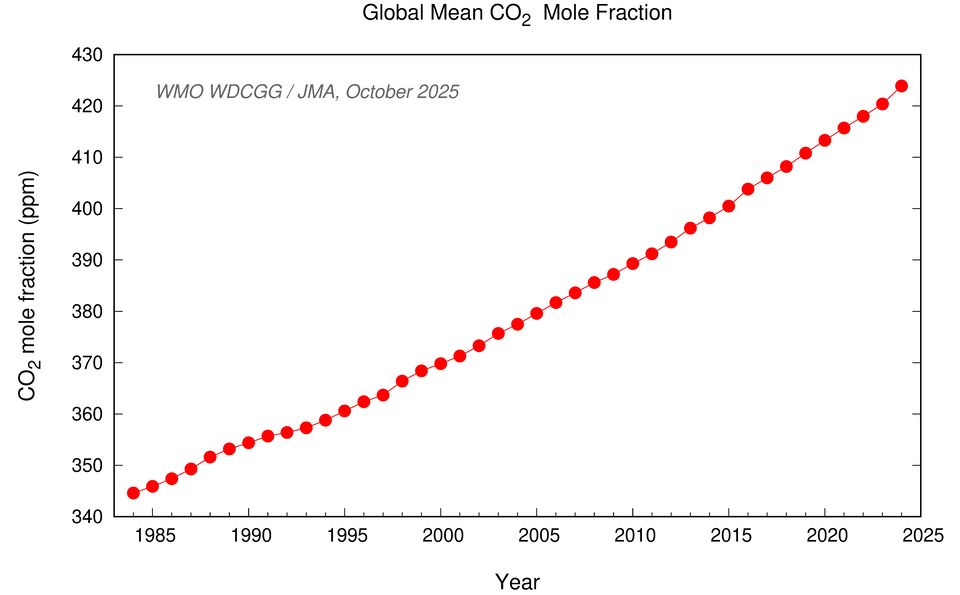
| CO2 |
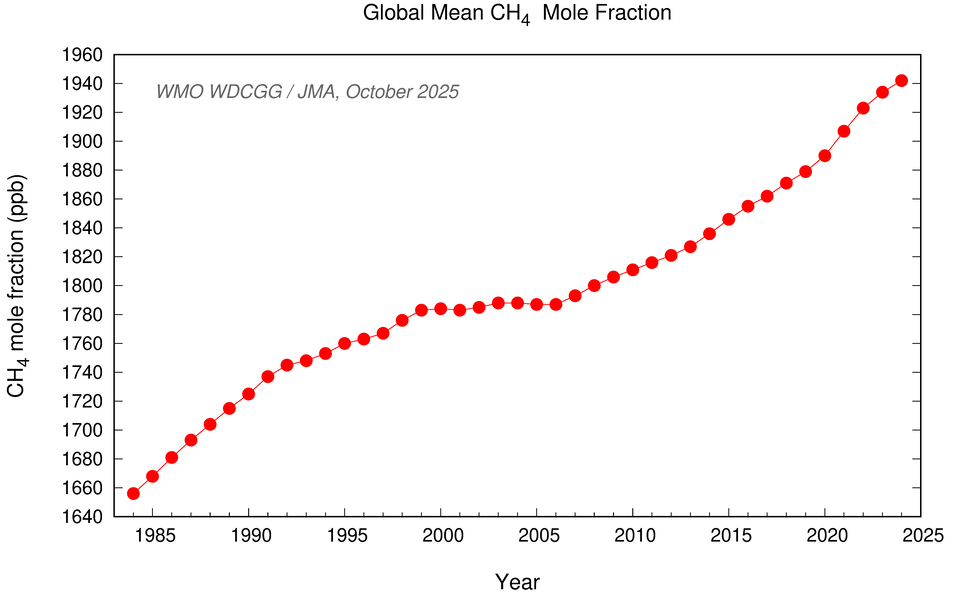
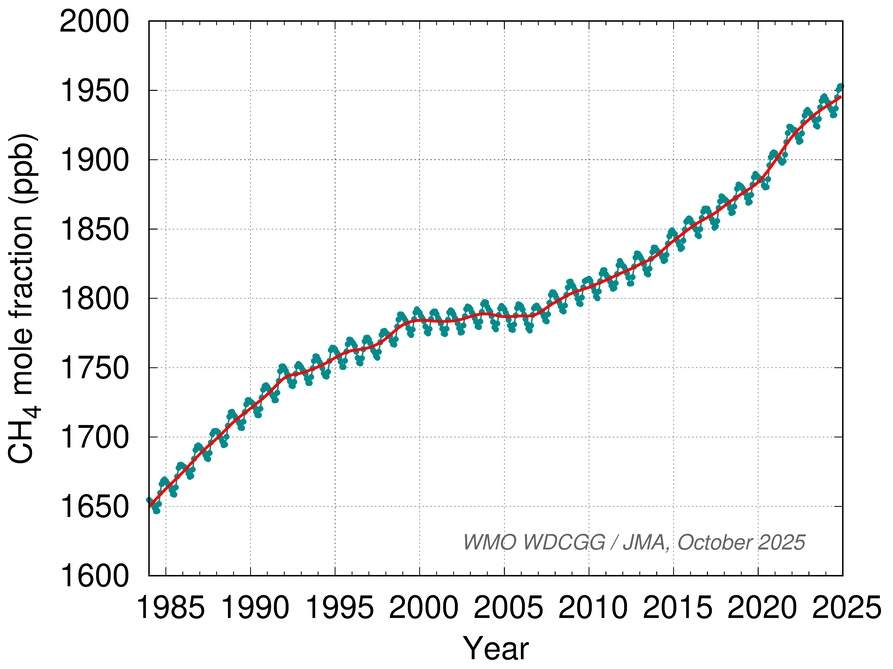
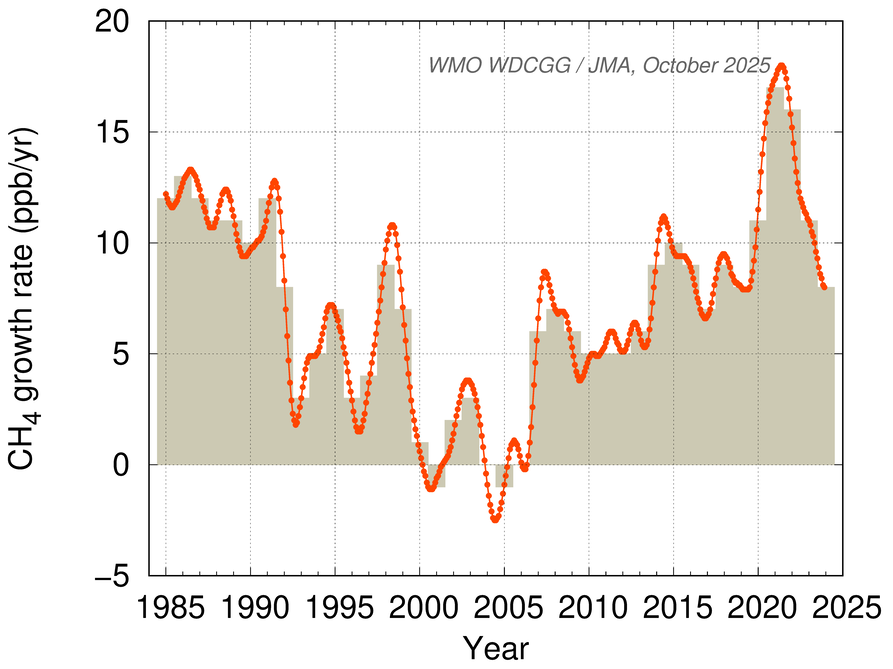
CH4 |
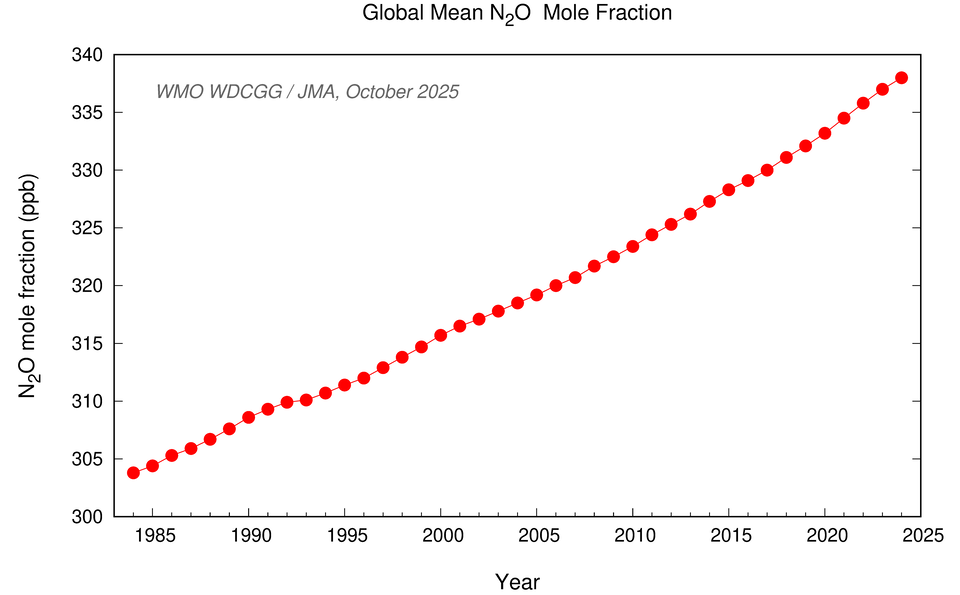
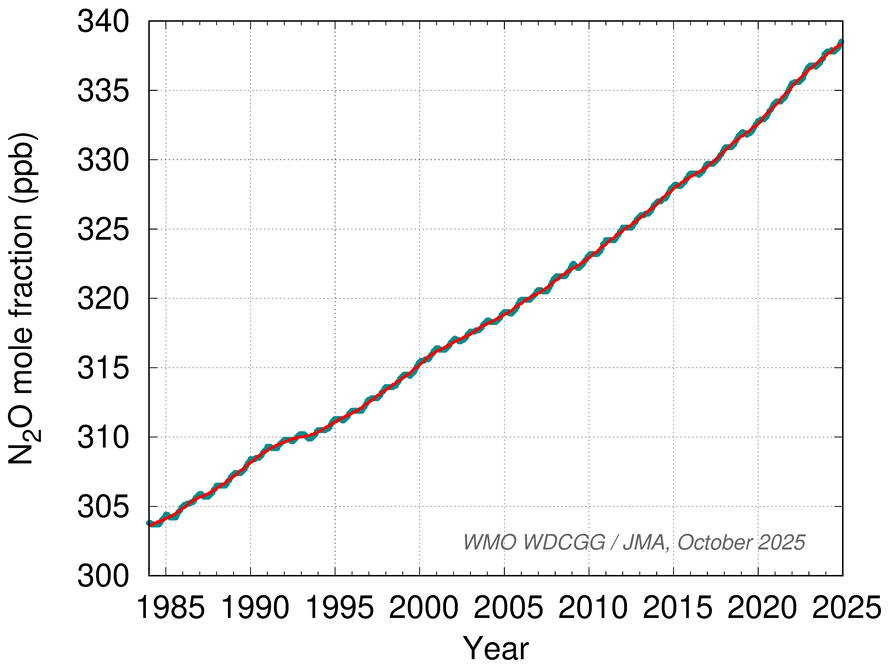
N2O |
|
| Data (csv file) |
Mole fraction, Uncertainty |
Mole fraction, Uncertainty |
Mole fraction, Uncertainty |
|
|
|||||||||||||||||||||||||||||||||||||||||||||||||||||||||||||||||||||||||||||||||||||||||||||||||||||||||||||||||||||||||||||||||||||||||||||||||||||||||||||||||||||||||||||||||||||||||||||||||||||||||||||||||||||||||||||||||||||||||||||||||||||||||||||||||||||||||||||||||||||||||||||||||||||||||||||||
| CO2 |
CH4 |
N2O |
|
| Data (csv file) |
Mole fraction, Growth rate |
Mole fraction, Growth rate |
Mole fraction, Growth rate |
| CO2 |
CH4 |
N2O |
|
|---|---|---|---|
| Mole fraction | 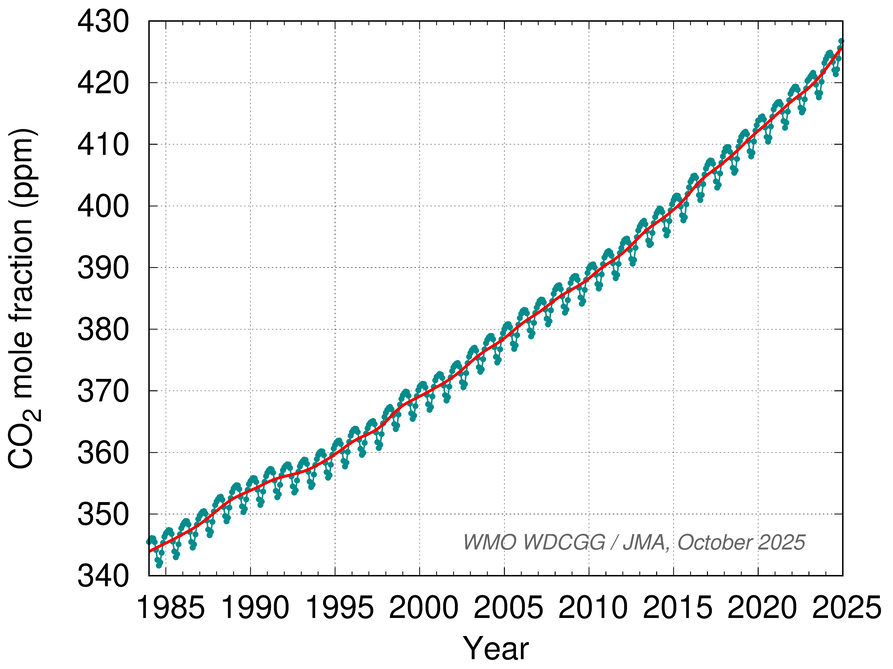 |
 |
 |
| Growth rate | 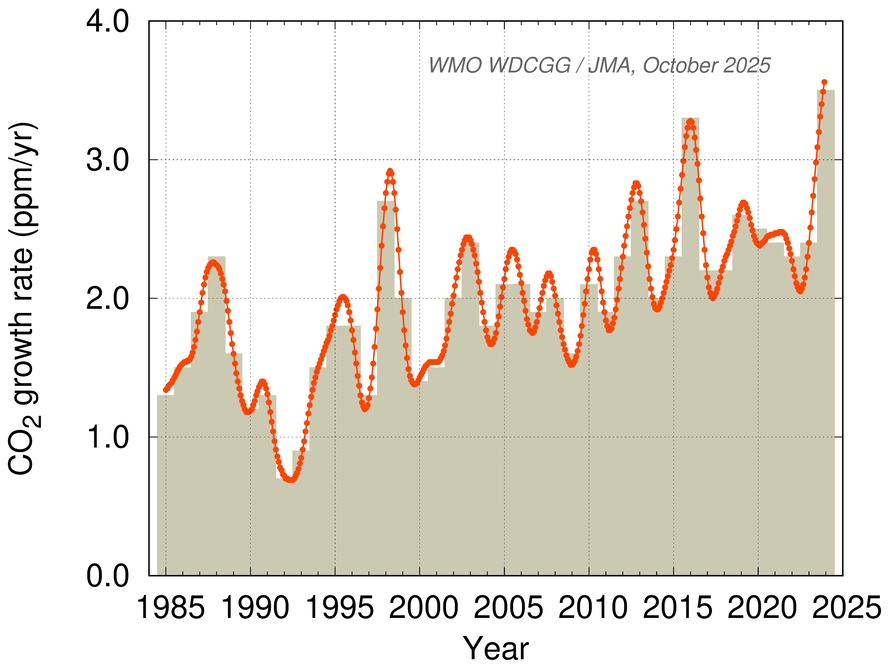 |
 |
 |
| CO2 |
CH4 |
N2O |
|---|---|---|
 |
 |
 |
Since 2006, WMO has published annual Greenhouse Gas Bulletins. These Bulletins report on the latest atmospheric abundances and rates of change for the main long-lived greenhouse gases (LLGHGs) — carbon dioxide (CO2), methane (CH4), nitrous oxide (N2O) — and provide a summary of contributions from other greenhouse gases. Submission of original observation data from WMO GAW contributors worldwide supports WDCGG's global analysis of major greenhouse gases for the Greenhouse Gas Bulletin.
This page provides globally averaged data and associated graphs for CO2, CH4 and N2O as used in the Bulletin. The information is updated annually based on newly submitted observation data.
WDCGG global analysis is conducted after careful screening of observation data exclusively from stations at which WMO-traceable scales are adopted. Details of the analysis are provided in GAW Report No.184(1).
The National Oceanic and Atmospheric Administration Global Monitoring Laboratory (NOAA/GML; the largest contributor of data to WDCGG) also calculates globally averaged mole fractions for major greenhouse gases(4). The main difference in global analysis between NOAA/GML and WDCGG is the site selection process. NOAA/GML focuses on greenhouse gas data from the marine boundary layer (MBL) to represent the background atmosphere, while WDCGG also uses data from inland stations(5) after stringent evaluation of their representativeness and traceability to WMO GAW standard scales.
Due to this difference, WDCGG globally averaged mole fractions for CO2 are around 0.4 ppm greater than those from NOAA/GML(1). However, CO2 trends and interannual variability are similar with both approaches.
| Organization | Acronym | Country/Territory |
|---|---|---|
| Advanced Global Atmospheric Gases Experiment Science Team(AGAGE) | AGAGE | Multinational |
| Agency on Hydrometeorology under Ministry of Emergency Situations of the Kyrgyz Republic | Kyrgyzhydromet | Kyrgyzstan |
| AGH University of Krakow | AGH | Poland |
| Atmospheric Chemistry Research Group School of Chemistry University of Bristol | UNIVBRIS | United Kingdom of Great Britain and Northern Ireland |
| Center for Environmental Science in Saitama | SAIPF | Japan |
| China Meteorological Administration | CMA | China |
| Commonwealth Scientific and Industrial Research Organisation | CSIRO | Australia |
| Direccion Meteorologica de Chile | DMC | Chile |
| Direcion Nacional del Antartico- Istituto Antartico Argentino, Buenos Aires, Argentina | IAA | Argentina |
| Environment and Climate Change Canada | ECCC | Canada |
| Federal Environment Agency Austria | UBAA | Austria |
| Finnish Meteorological Institute | FMI | Finland |
| German Environment Agency | UBAG | Germany |
| German Meteorological Service | DWD | Germany |
| Global Monitoring Laboratory, NOAA | NOAA | United States of America |
| Hong Kong Observatory | HKO | Hong Kong, China |
| Hungarian Meteorological Service | HMS | Hungary |
| Institute for Nuclear Research | ATOMKI | Hungary |
| Integrated Carbon Observation System Research Infrastructure | ICOS | Multinational |
| Italian Air Force Mountain Centre | IAFMS | Italy |
| Italian National Agency for New Technologies, Energy and Sustainable Economic Development | ENEA | Italy |
| Japan Meteorological Agency | JMA | Japan |
| Kenya Meteorological Department | KMD | Kenya |
| Korea Meteorological Administration | KMA | Republic of Korea |
| Laboratoire des Sciences du Climat et de l'Environnement | LSCE | France |
| Meteorological Research Institute | MRI | Japan |
| National Institute for Environmental Studies | NIES | Japan |
| National Institute of Environmental Research | GERC | Republic of Korea |
| National Institute of Meteorological Research, KMA | METRI | Republic of Korea |
| National Institute of Water & Atmospheric Research Ltd. | NIWA | New Zealand |
| National Physical Laboratory | NPL | United Kingdom of Great Britain and Northern Ireland |
| National Research Council, Institute of Atmospheric Sciences and Climate | ISAC | Italy |
| Norwegian Institute for Air Research | NILU | Norway |
| Ricerca sul Sistema Energetico - RSE S.p.A. | RSE | Italy |
| South African Weather Service | SAWS | South Africa |
| State Meteorological Agency of Spain | AEMET | Spain |
| Swiss Federal Laboratories for Materials Science and Technology | Empa | Switzerland |
| Tohoku University | TU | Japan |
| University of Exeter | UoE | United Kingdom of Great Britain and Northern Ireland |
| University of Urbino, Dep. of Pure and Applied Sciences (DISPEA) | UNIURB | Italy |
| University of York | UYRK | United Kingdom of Great Britain and Northern Ireland |
| Viet Nam Meteorological and Hydrological Administration | VNMHA | Viet Nam |
| Voeikov Main Geophysical Observatory | MGO | Russian Federation |
| (1) |
Tsutsumi, Y., K. Mori, T. Hirahara, M. Ikegami, and T. J. Conway, 2009, Technical Report of Global Analysis Method for Major Greenhouse Gases by the World Data Center for Greenhouse Gases, GAW Report No.184 |
|
| (2) |
Conway, T. J., P. P. Tans, L. S. Waterman, K. W. Thoning, D. R. Kitzis, K. A. Masarie, and N. Zhang, 1994, Evidence for interannual variability of the carbon cycle from the NOAA/CMDL global air sampling network, J. Geophys. Res., vol.99, 22831-22855, https://doi.org/10.1029/94JD01951. |
|
| (3) |
Technical Note on uncertainty for the GHG global mean mole fractions by the WDCGG |
|
| (4) |
Trends in Atmospheric Carbon Dioxide by NOAA/GML https://gml.noaa.gov/ccgg/trends/global.html |
|
| (5) |
Station distribution map for the WDCGG global analysis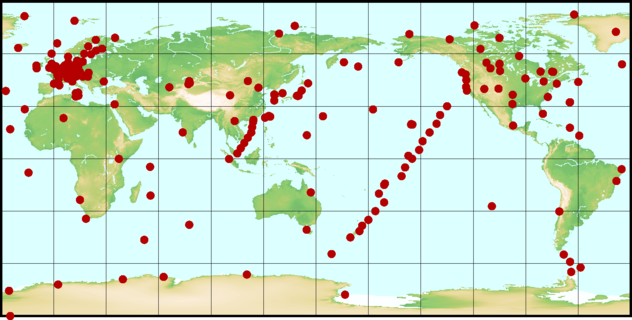
|
 |
  |
 |
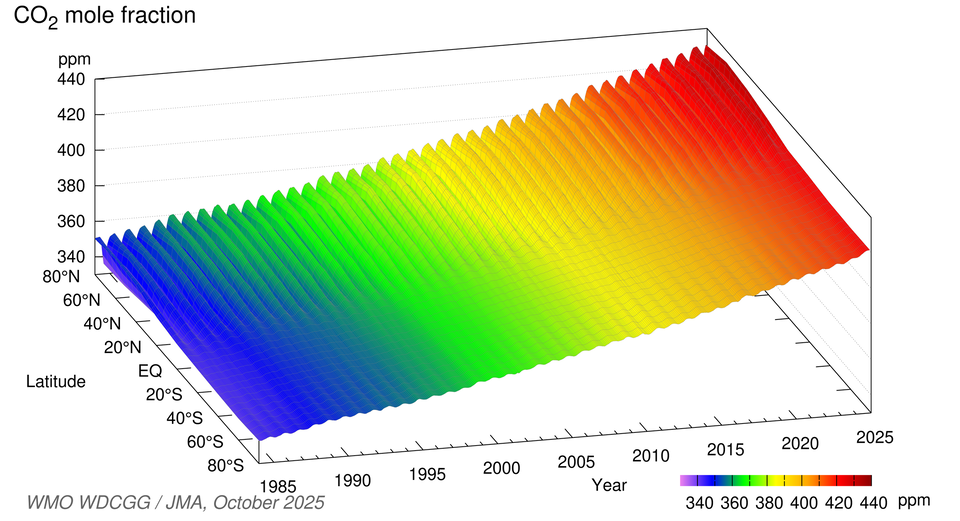
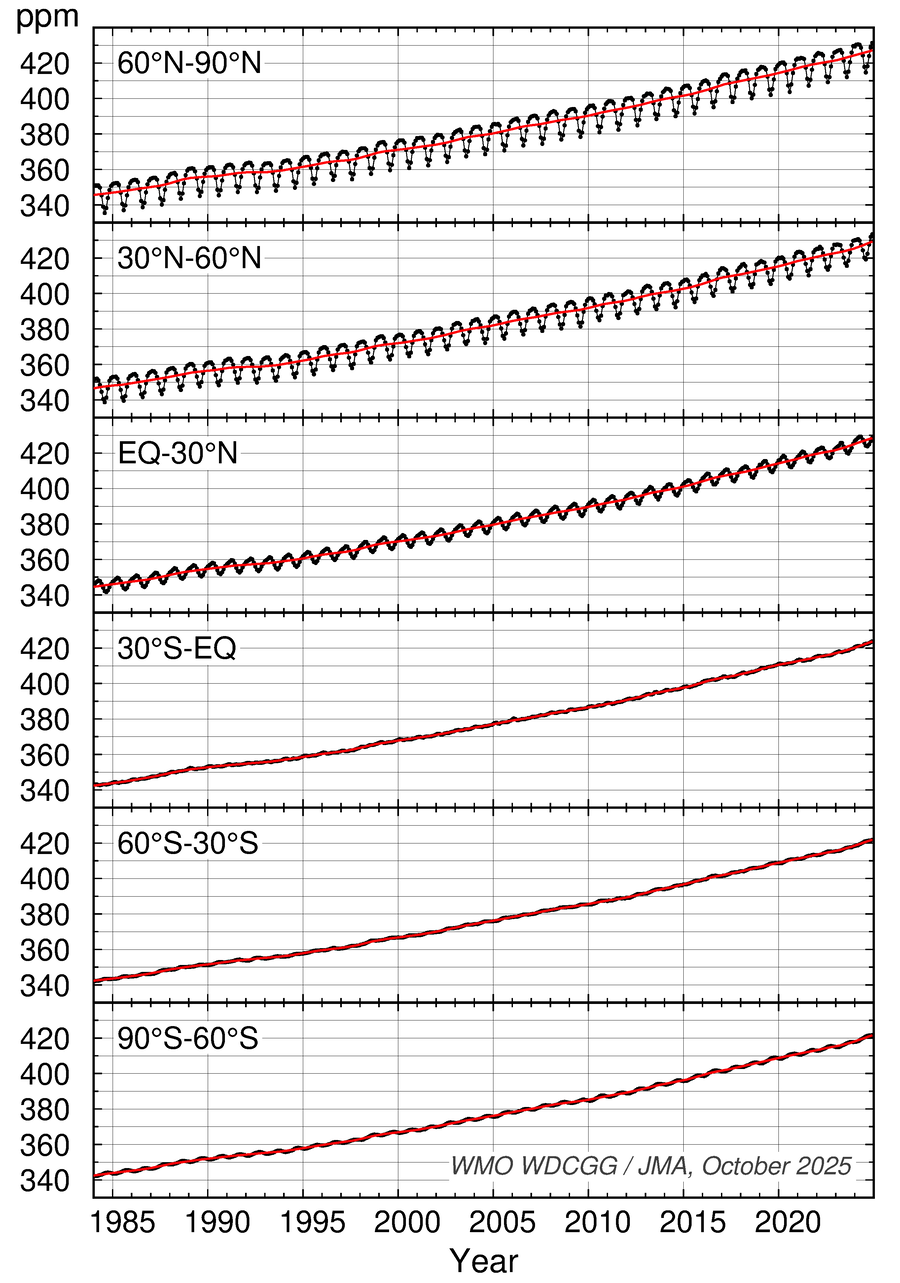
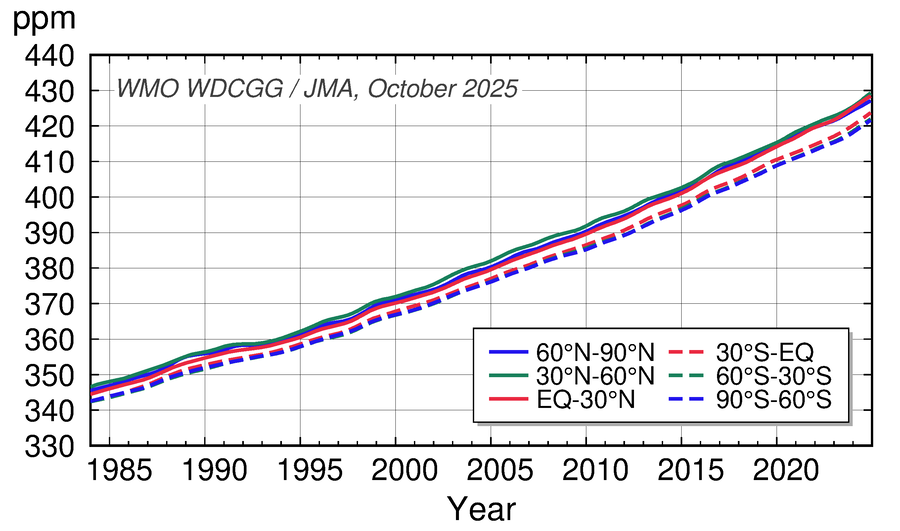
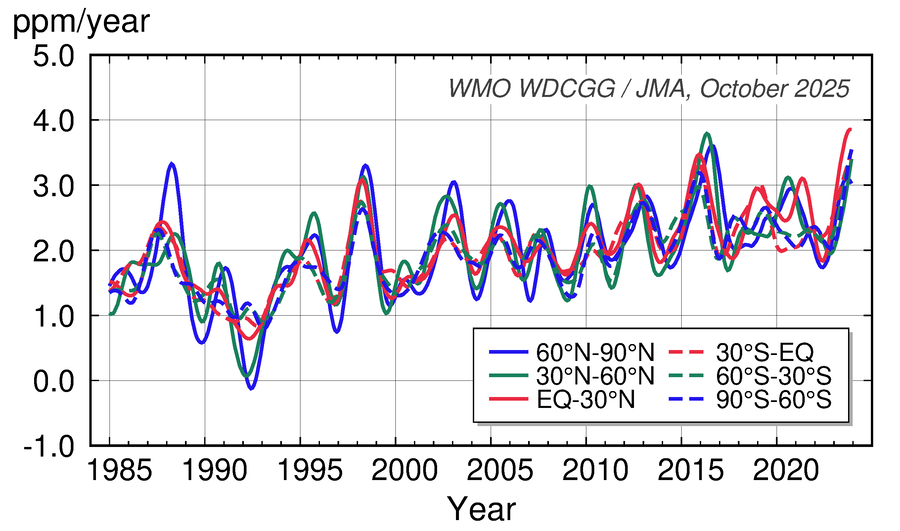
| Monthly mean mole fractions of CO2 from 1984 onward averaged over each 30° latitudinal zone (black) and their deseasonalized long-term trends (red). | Long-term trends of the CO2 mole fractions for each 30° latitudinal zone (top) and their growth rates (bottom). | Average seasonal cycles of the CO2 mole fractions for each 30° latitudinal zone obtained by subtracting long-term trends from the zonally averaged time series. Vertical error bars represent the range of ±1σ which was calculated for each month (period 1984 onward). |
 |
  |
 |
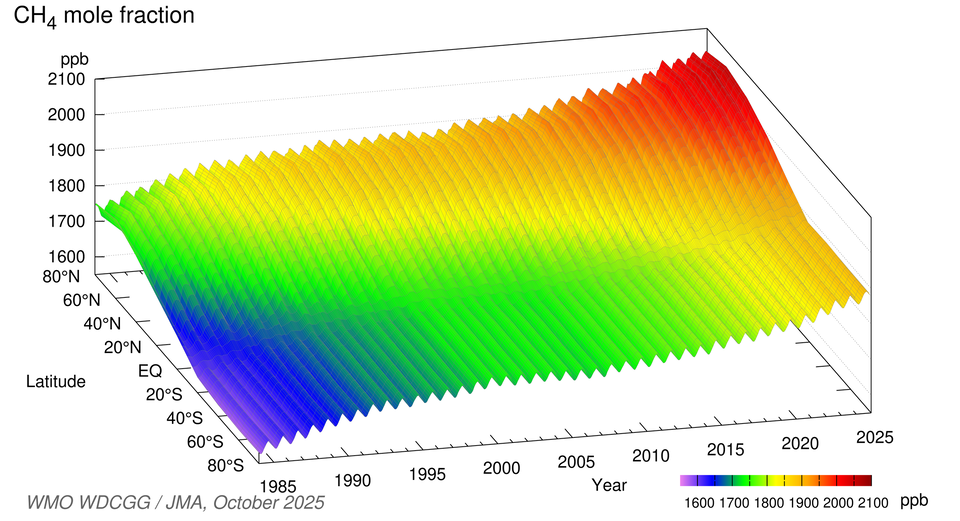
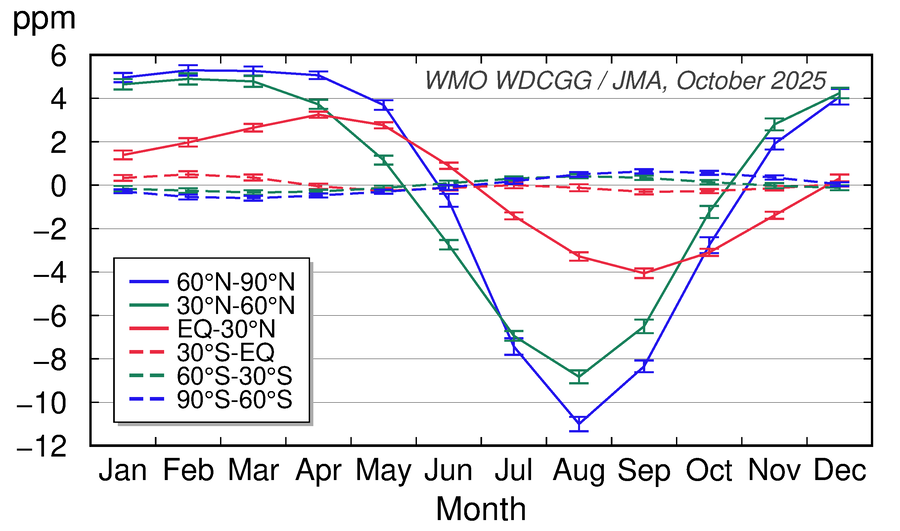
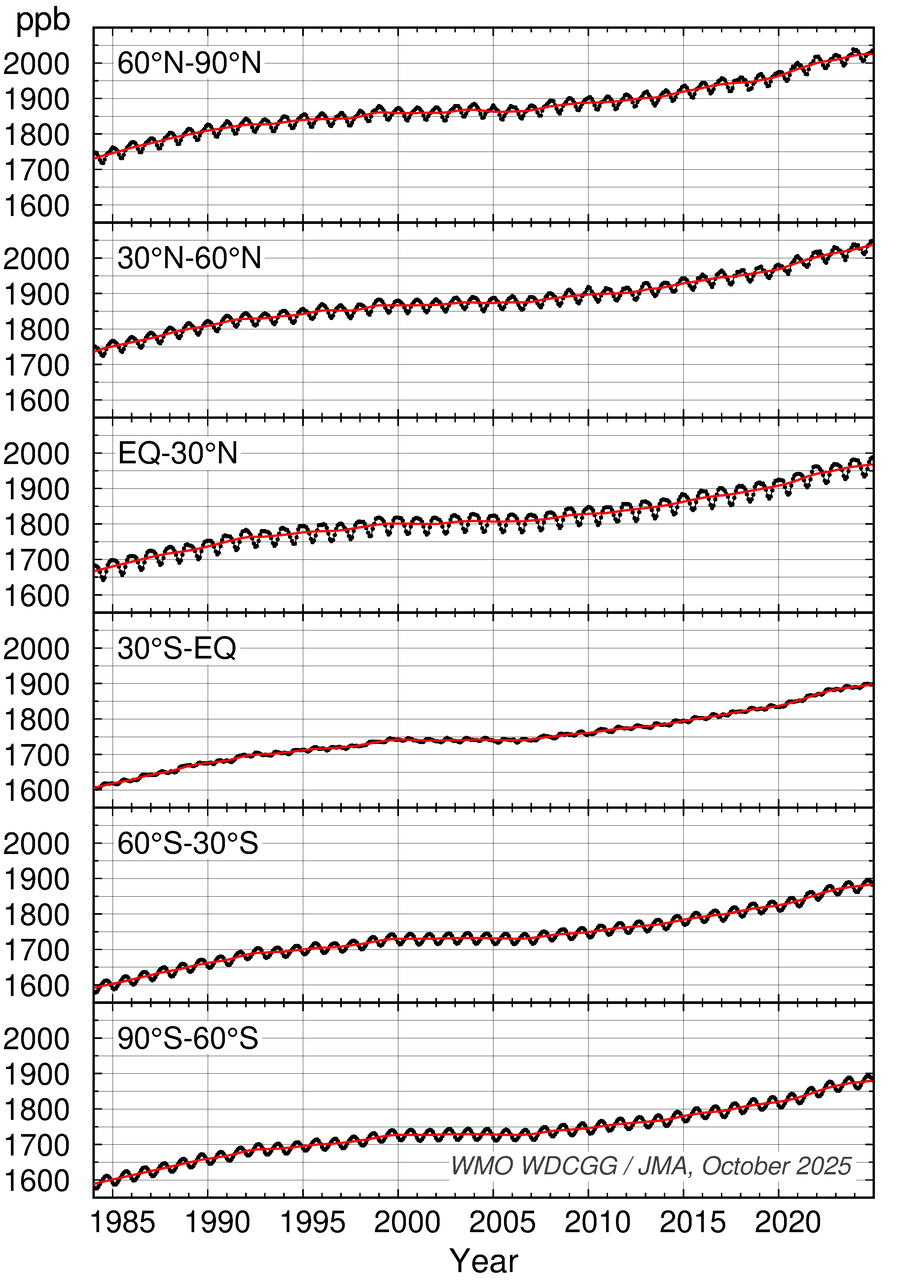
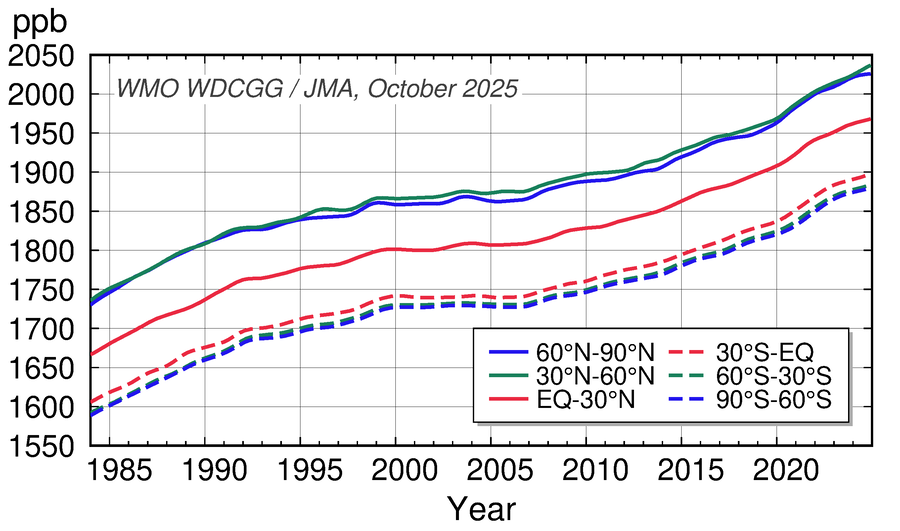
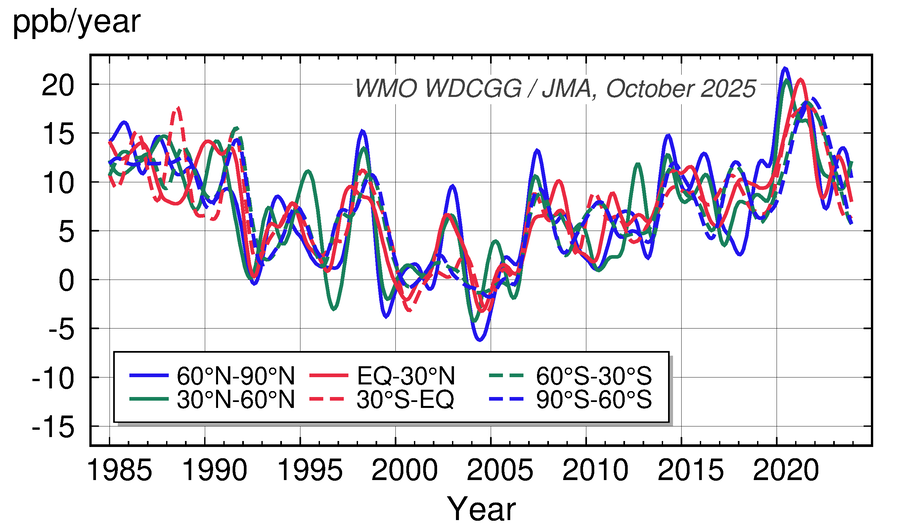
| Monthly mean mole fractions of CH4 from 1984 onward for each 30° latitudinal zone (black) and their deseasonalized long-term trends (red). | Long-term trends of the CH4 mole fractions for each 30° latitudinal zone (top) and their growth rates (bottom). | Average seasonal cycles of CH4 mole fractions for each 30° latitudinal zone obtained by subtracting long-term trends from the zonally averaged time series. Vertical error bars represent the range of ±1σ which was calculated for each month (period 1984 onward). |
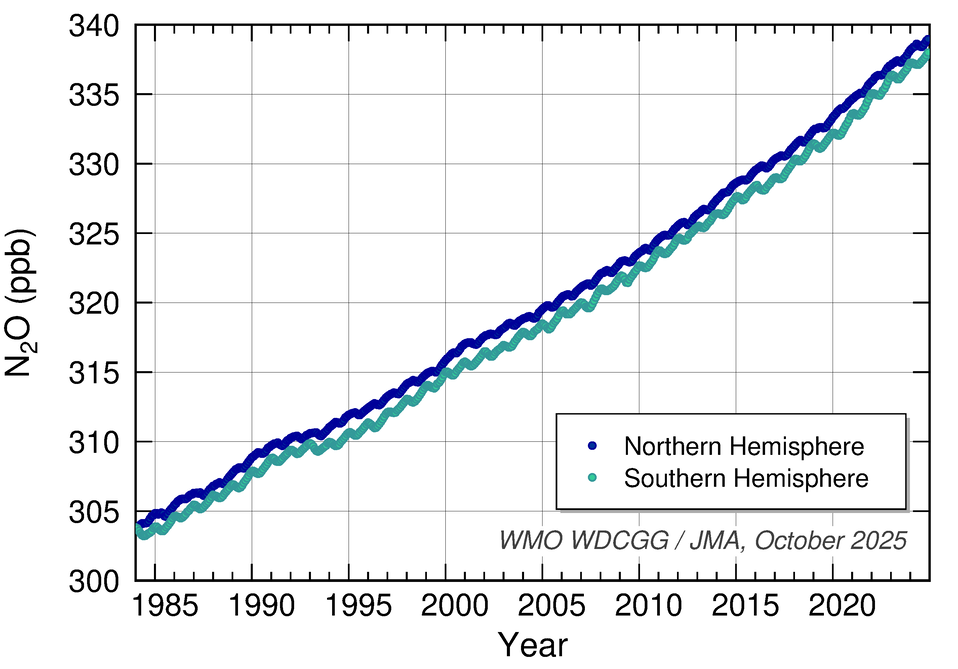 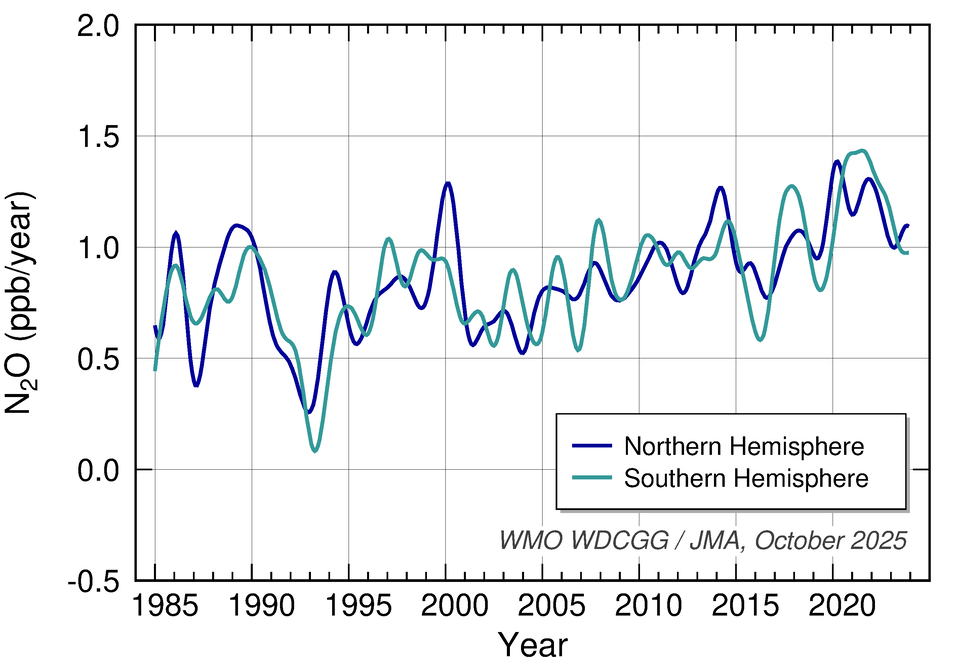 |
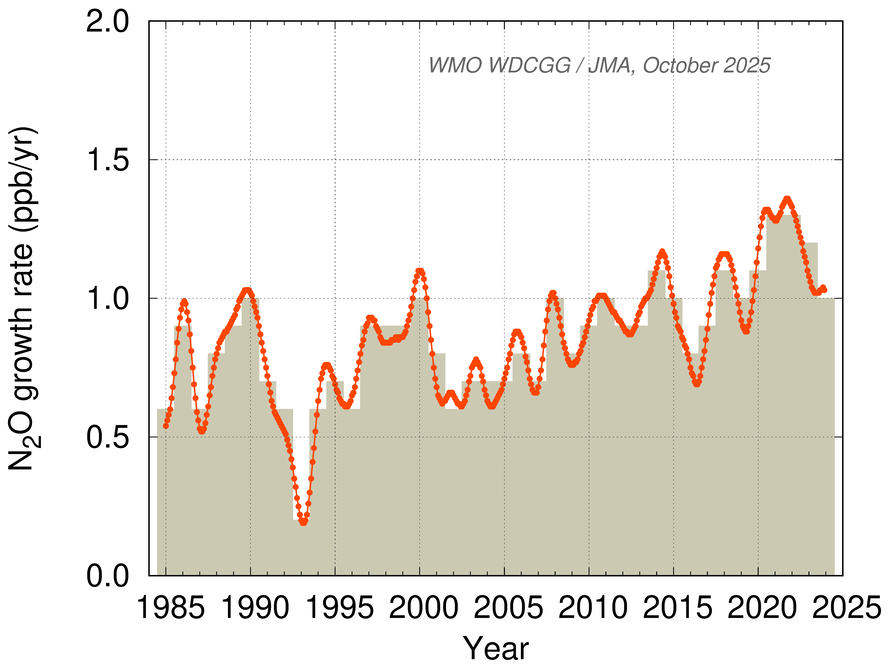
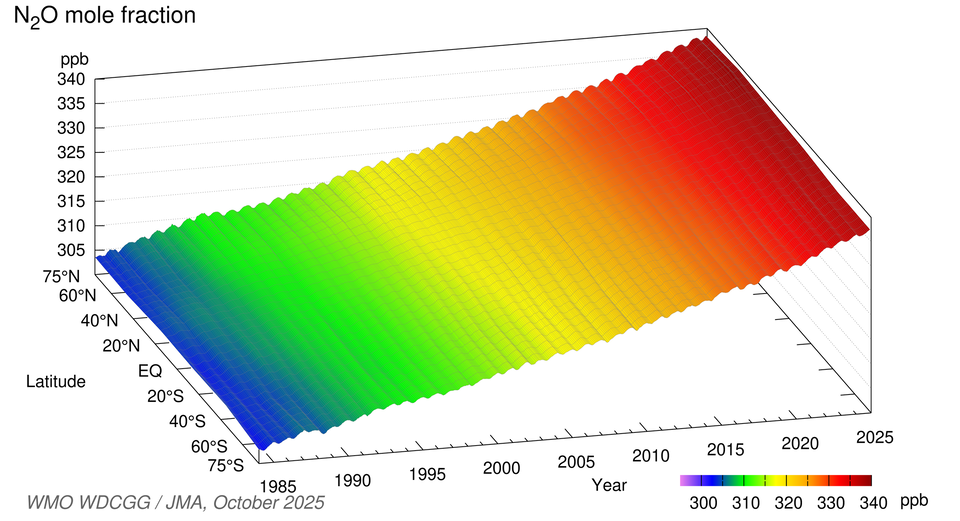
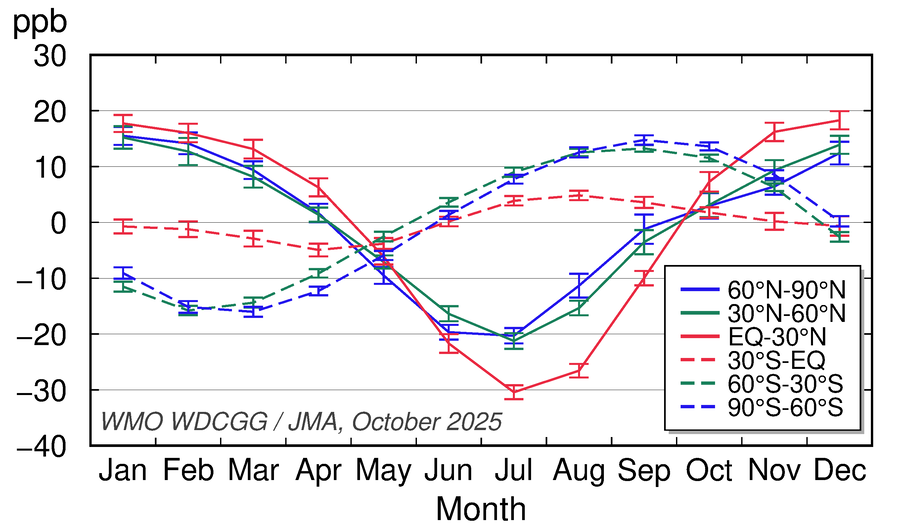
| Monthly mean mole fractions of N2O from 1984 onward (top) and their growth rates (bottom), averaged over the Northern and Southern Hemispheres. |
|
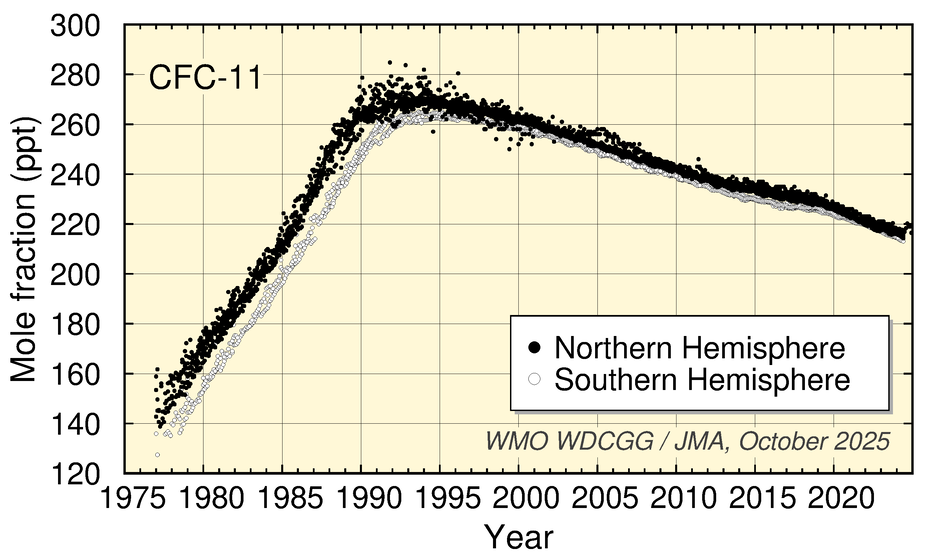
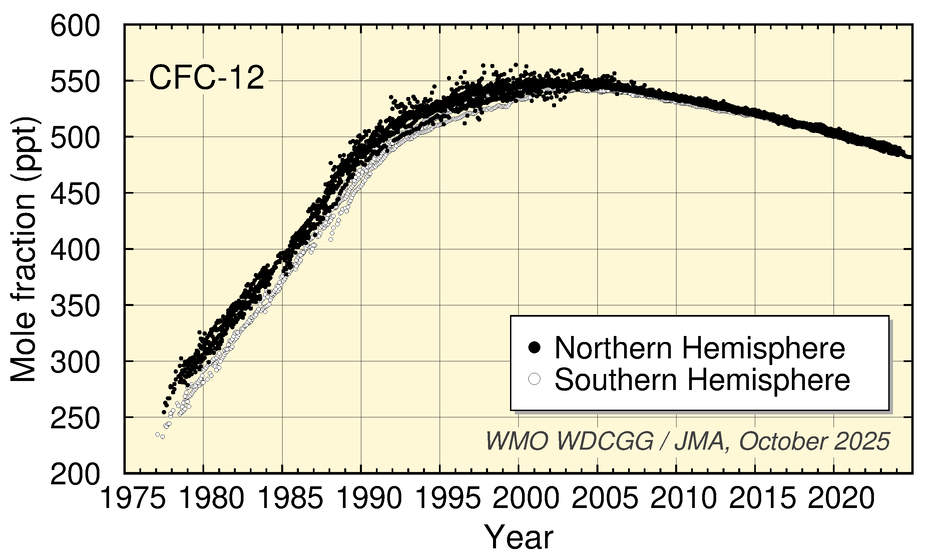
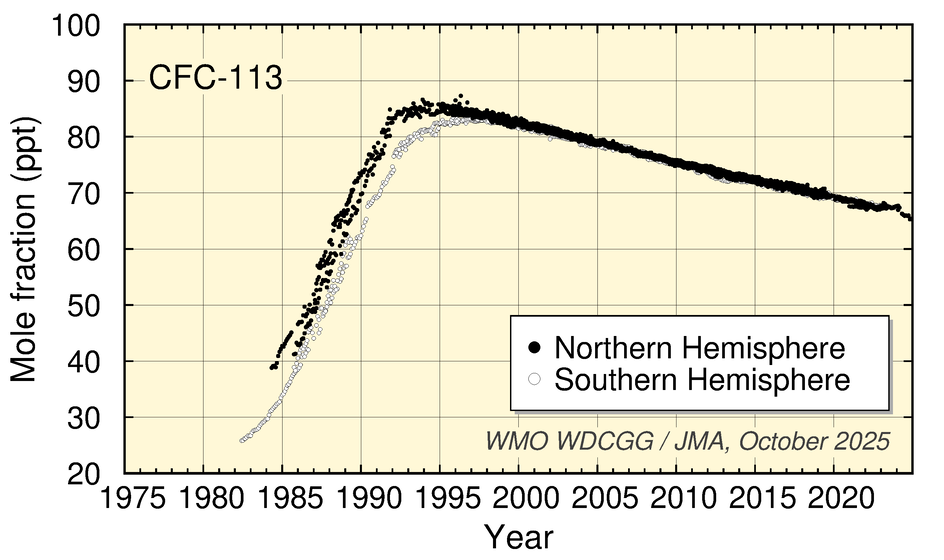
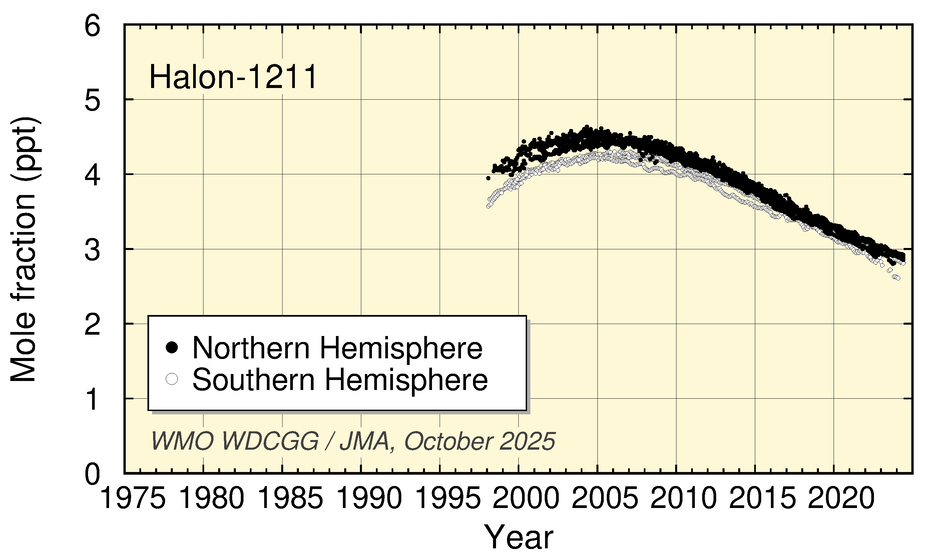
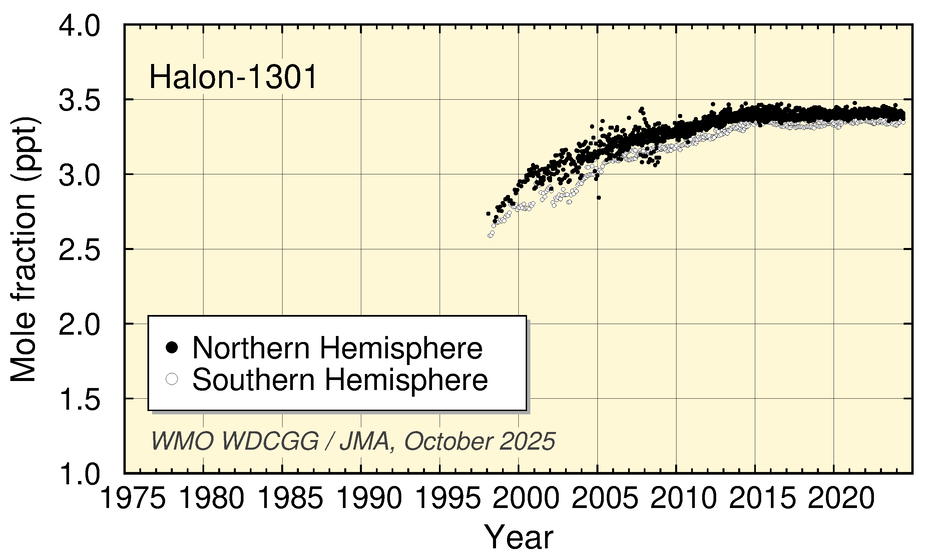
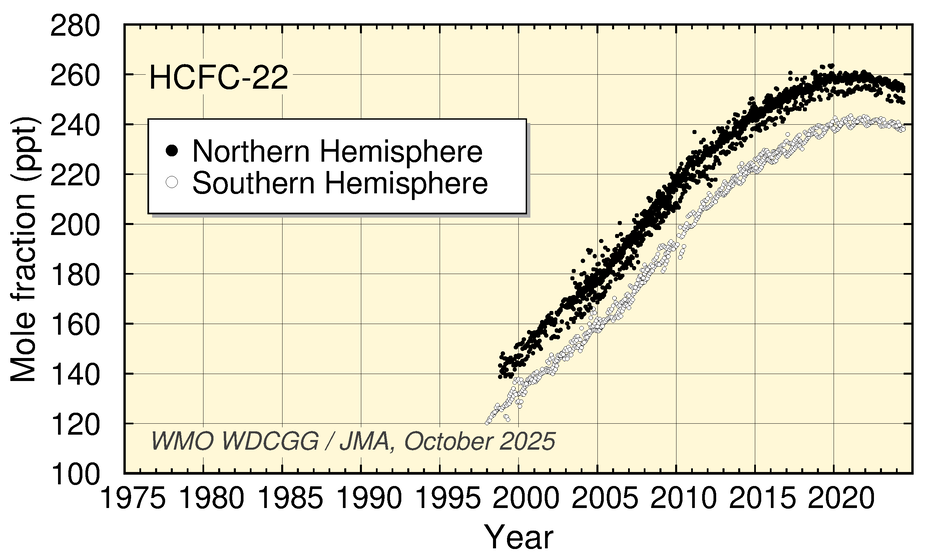
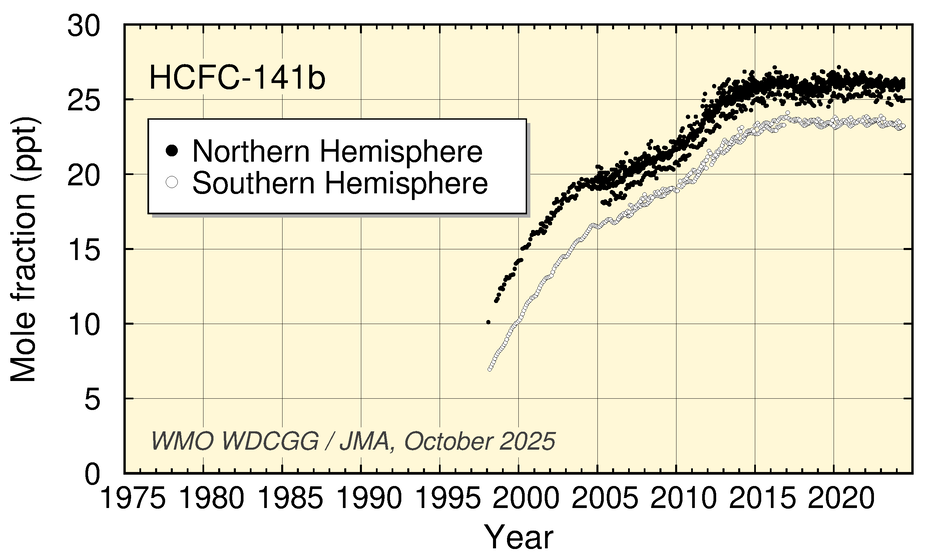
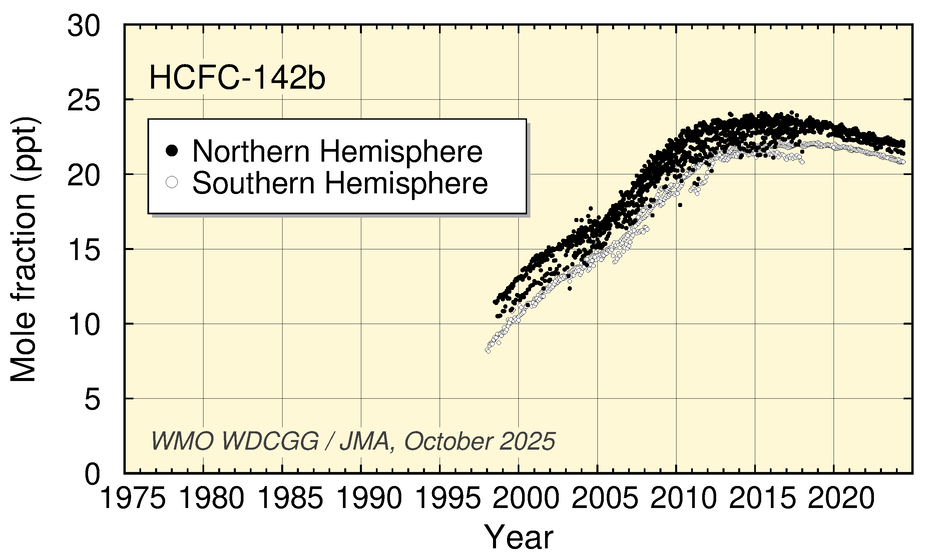
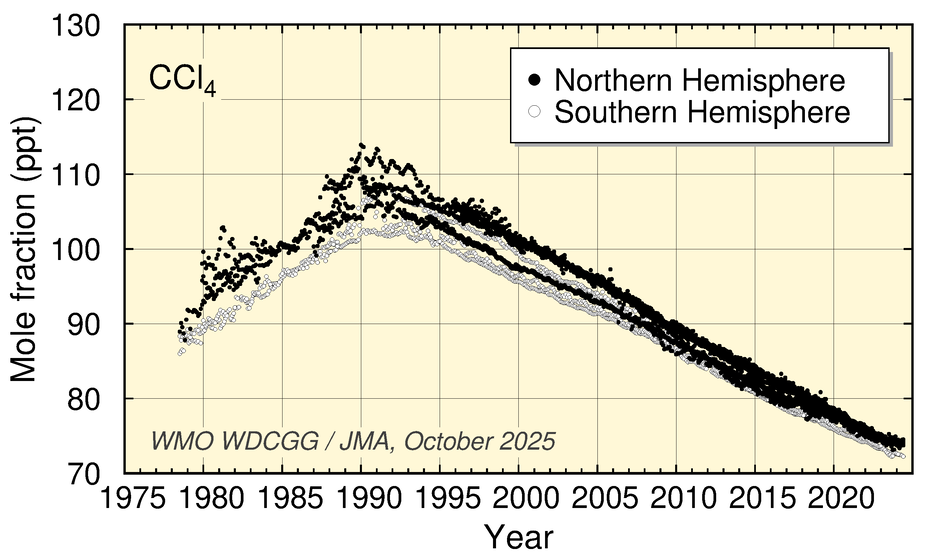
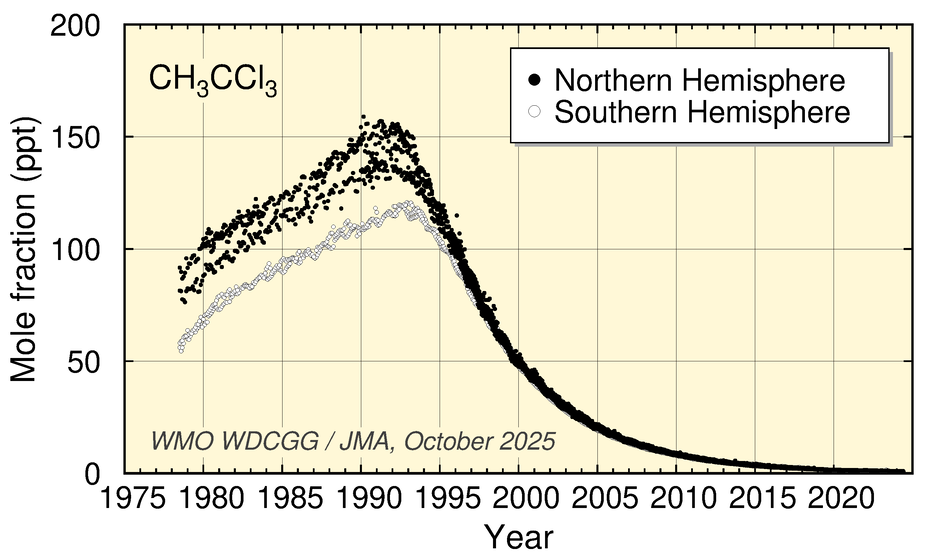
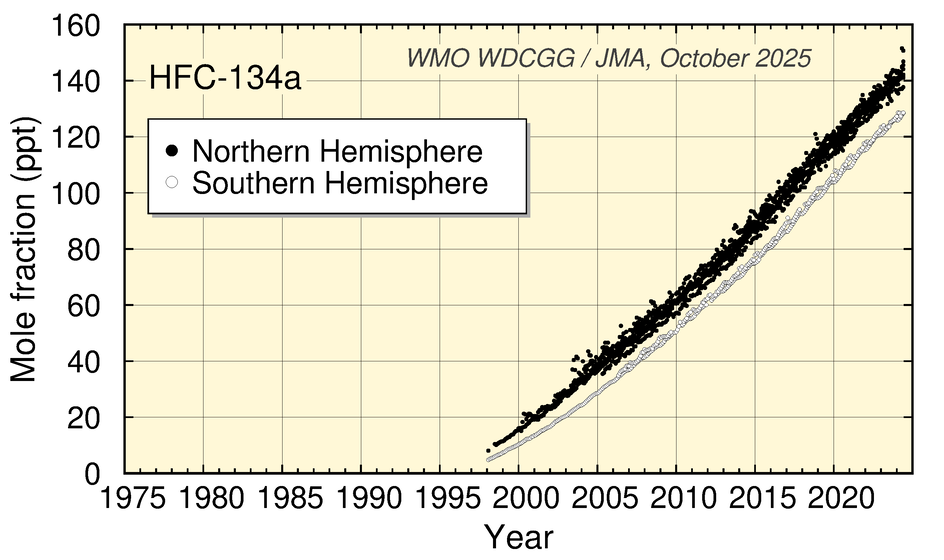
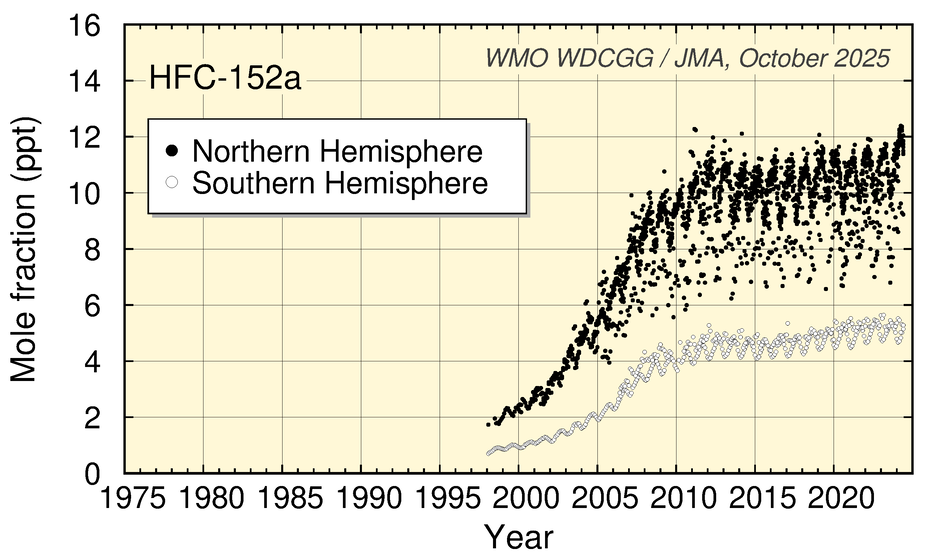
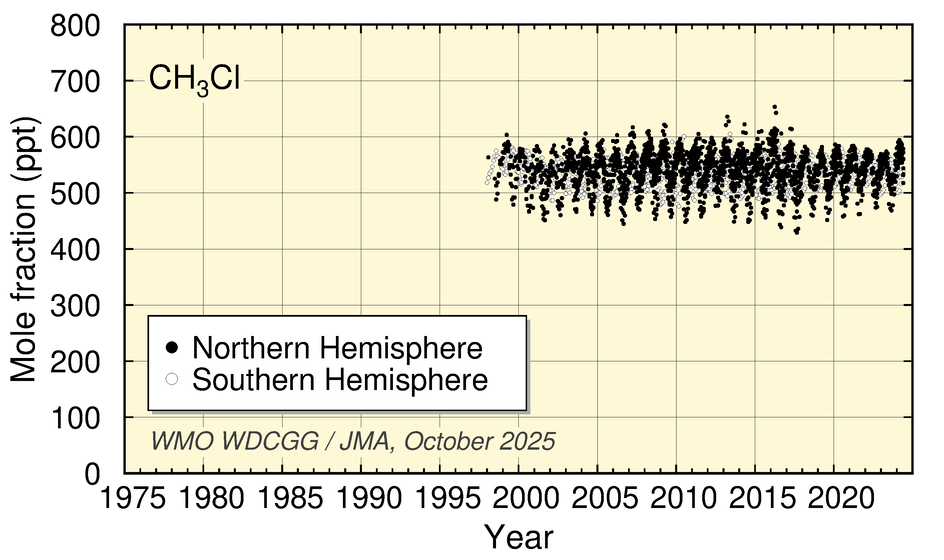
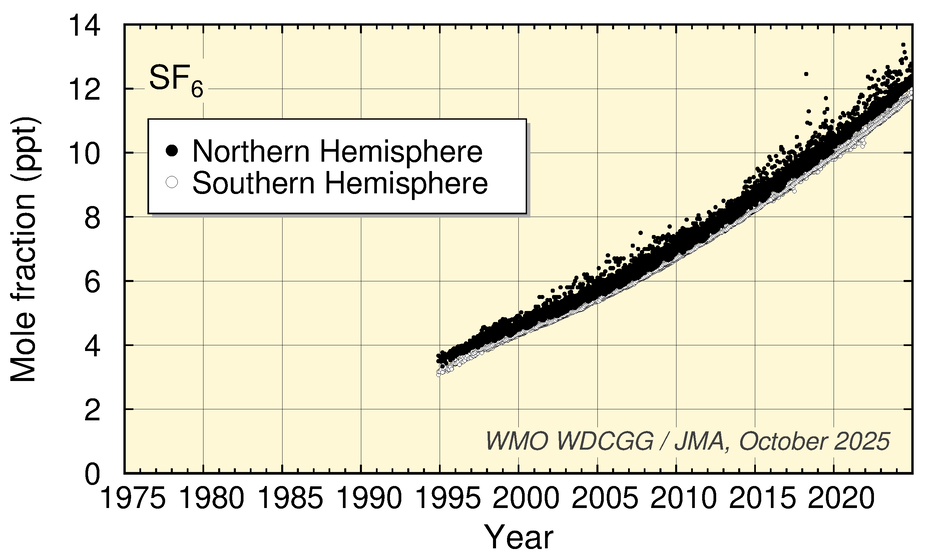
| Time series of the monthly mean mole fractions of halocarbons, other halogenated species and sulfur hexafluoride at individual stations. Solid circles show mole fractions in the Northern Hemisphere and open circles show those measured in the Southern Hemisphere. Monthly mean mole fractions from observations at individual stations are directly presented on the plots. Scale differences are not taken into account in this analysis, except for CFCs. |
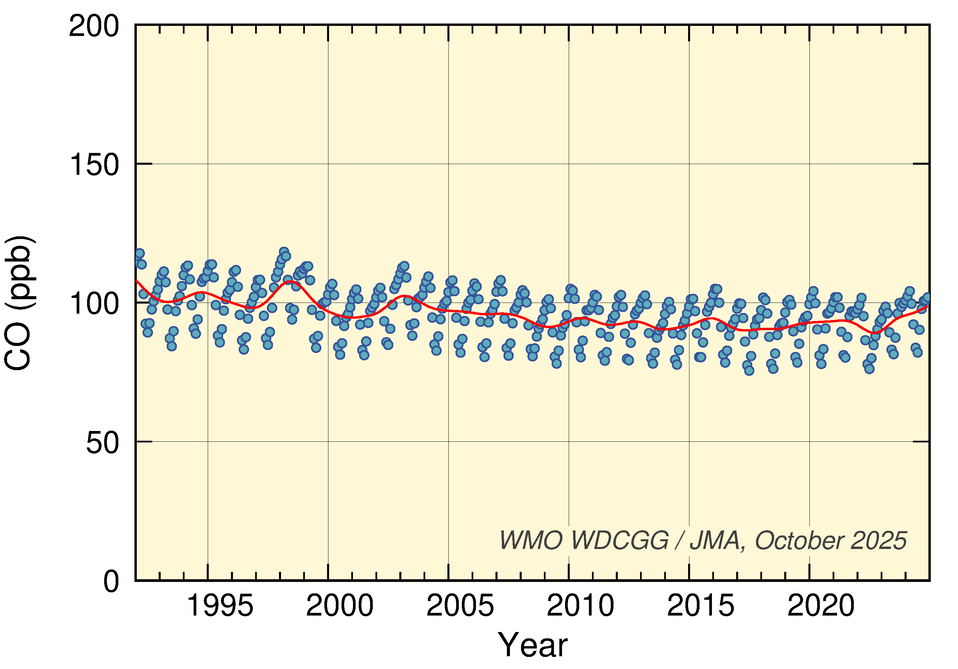
| 2024 Global Annual Mean Mole Fraction | |
|---|---|
| Mole Fraction | Uncertainty |
| 96 ppb | 2 ppb |
  |
 |
  |
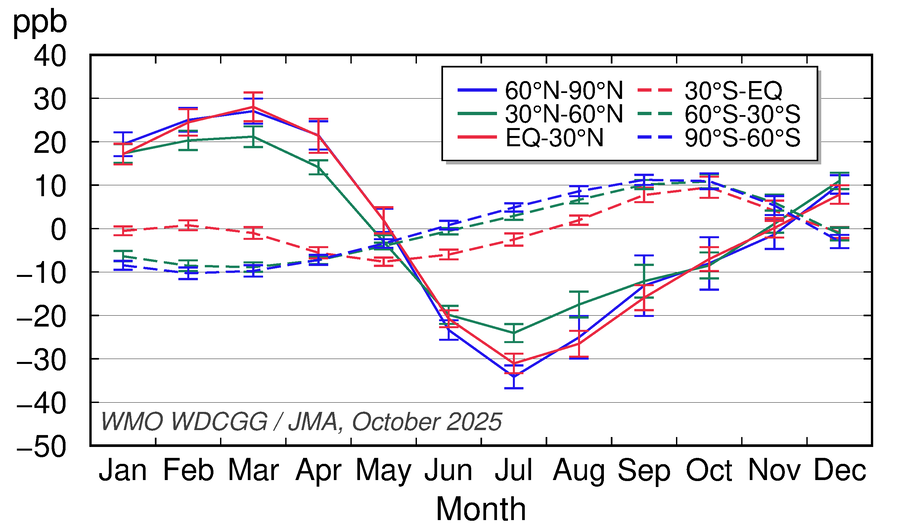 |
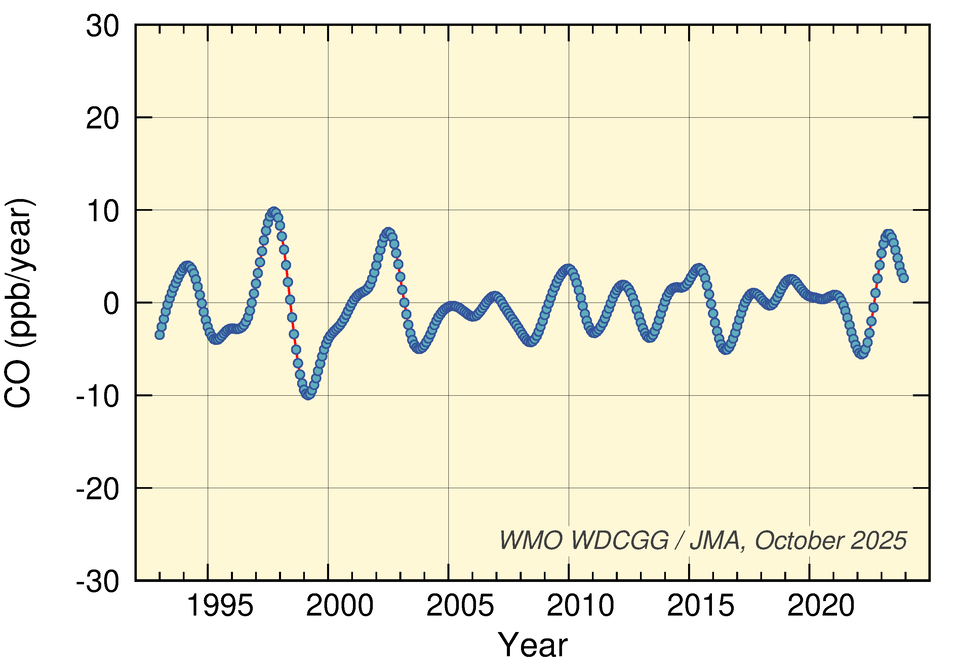
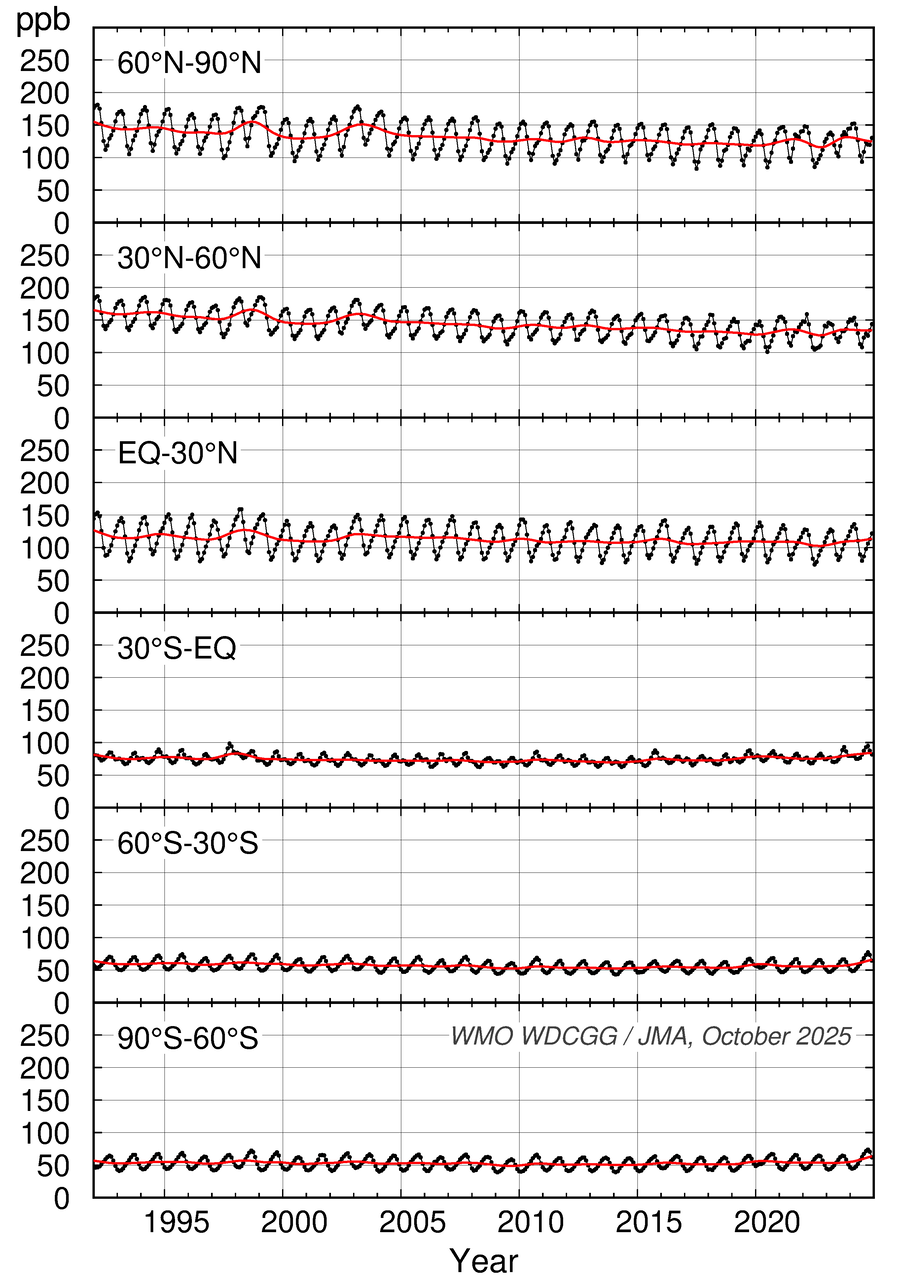
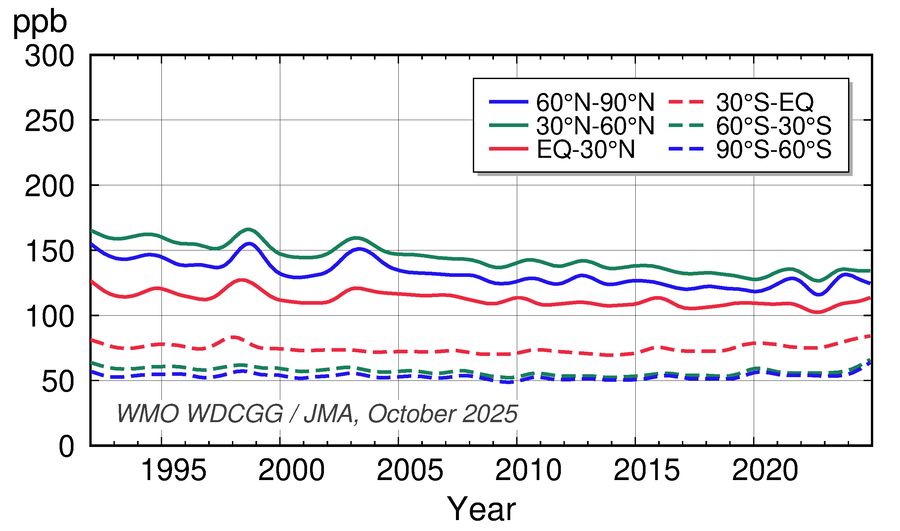
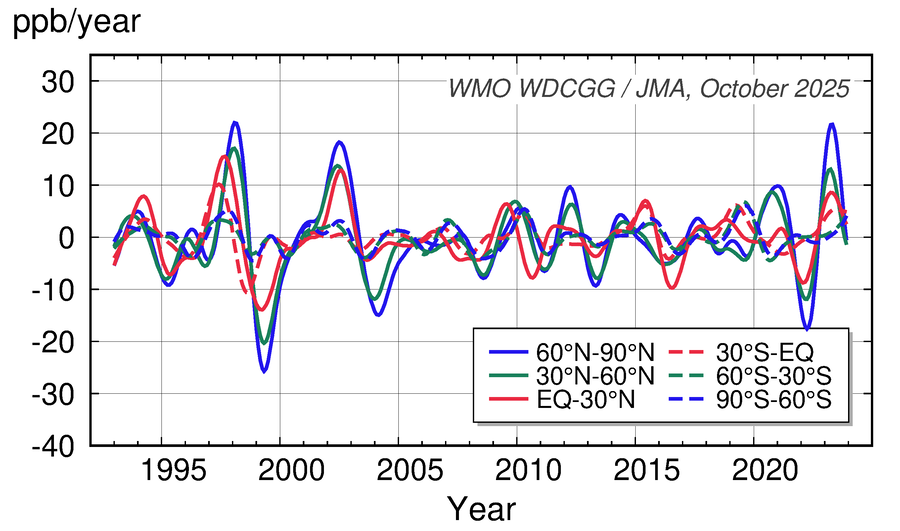
| Globally averaged monthly mean mole fractions of CO from 1992 onward (top) and its growth rate (bottom). Red line on the top panel presents the deseasonalized long-term trend. | Monthly mean mole fractions of CO from 1992 onward for each 30° latitudinal zone (black) and their deseasonalized long-term trends (red). | Deseasonalized long-term trends of CO for each 30° latitudinal zone (top) and their growth rates (bottom). | Average seasonal cycles of CO mole fractions for each 30° latitudinal zone obtained by subtracting long-term trends from the zonally averaged time series. Error bars represent the range of ±1σ calculated for each month (period 1992 onward). |