Data Policy
GAW Data Policy
"For Scientific purposes, access to these data is unlimited and provided without charge.
By their use you accept that an offer of co-authorship will be made through personal contact with the data providers
or owners whenever substantial use is made of their data.
In all cases, an acknowledgement must be made to the data providers or owners and to the data centre when these data are used within a publication."
Version
2025-03-19-1326 (Last updated: 2025-04-01)File
This data set is submitted by UYRK.
In line with the GAW Data Policy, users should contact the contributors of all data of interest and propose co-authorship or acknowledgement.
Organization
| NO | 76 |
|---|---|
| Acronym | UYRK |
| Name | University of York |
| Address 1 | |
| Address 2 | NCAS, University of York |
| Address 3 | York YO10 5DD United Kingdom |
| Country/Territory | United Kingdom of Great Britain and Northern Ireland |
| Website | http://www.york.ac.uk/ |
Contact(s)
| Name | Katie Read |
|---|---|
| Prefix | Dr. |
| katie.read@york.ac.uk | |
| Organization No | 76 |
| Organization acronym | UYRK |
| Organization name | University of York |
| Organization country/territory | United Kingdom of Great Britain and Northern Ireland |
| Address 1 | NCAS, Department of Chemistry |
| Address 2 | University of York, Heslington |
| Address 3 | York YO10 5DD United Kingdom |
| Country/territory | United Kingdom of Great Britain and Northern Ireland |
| Tel | +44-1904-322565 |
| Fax | +44-1904-322516 |
| Last updated date | 2025-03-19 |
| Name | Lucy Carpenter |
|---|---|
| Prefix | Prof. |
| lucy.carpenter@york.ac.uk | |
| Organization No | 76 |
| Organization acronym | UYRK |
| Organization name | University of York |
| Organization country/territory | United Kingdom of Great Britain and Northern Ireland |
| Address 1 | NCAS, Department of Chemistry |
| Address 2 | University of York, Heslington |
| Address 3 | York YO10 5DD United Kingdom |
| Country/territory | United Kingdom of Great Britain and Northern Ireland |
| Tel | |
| Fax | |
| Last updated date | 2025-03-19 |
| Background observation | |
| UTC | |
| ppb | |
|
9999-12-31 00:00:00 - 9999-12-31 23:59:59: WMO CO X2014A |
|
|
2008-04-01 00:00:00 - 2015-05-31 23:59:59: Aerolaser 5001(VURF) 2015-06-01 00:00:00 - 9999-12-31 23:59:59: Picarro G2401(CRDS) |
|
|
9999-12-31 00:00:00 - 9999-12-31 23:59:59: 7.5 (m) |
|
| 4 seconds | |
|
Calibration of CO is performed with reference to a single gas standards containing a known amount of CO. It is well understood that the instrument behaves linearly but working standards are run routinely to check linearity. Calibrations and zeros are performed weekly and then the concentrations are calculated using a NOAA calibrated standard which has been evaluated for drift over the same period and taking into account a monthly averaged zero interpolated over the measurement period. The data is quality assured and flagged accrding to water vapour effects, local wind effects and contamination from a disturbed manifold. Instrument parameters (temperatures, flows, and gas pressures) are logged alongside those of the concentrations and used to diagnose problems. The carbon monoxide measurements are fully traceable to the international Global Atmospheric Watch (GAW) scale (currently NOAA/ESRL WMO-X2014A). This means that the gas calibration standards used to calculate the final concentrations are referenced to a common standard held at the NOAA/ESRL laboratory. To ensure this is upheld, the designated world calibration centre for Carbon Monoxide: WCC-Empa (http://www.empa.ch/plugin/template/empa/*/7571), carries out regular audits of the measurements using travelling standards. For more information please see the report from the most recent of these audits: http://www.wmo.int/pages/prog/arep/gaw/documents/CVO_2012.pdf |
|
|
Aerolaser . Data Treatment Zero data are removed and analysed off-line (average and standard deviation. The calibration data is also removed (inf data, filter using sensitivity column). Sometimes not all the data is flagged as inf so needs to be checked. The database is checked for any other potential problems to the data. During a power cut the logger records noise and so a very small signal is observed. This is not a background so does not need to be subtracted from the main data. Comparisons can always be made with the ad logged data if in doubt. If the instrument has been off for any time it is allowed a two hour warm-up period and this data is removed. If the instrument experiences a large change (> 5%) in sensitivity during a calibration (perhaps as a result of a water droplet finding its way into the instrument), this is seen in a sudden drop in concentration. Once the instrument has been calibrated again the data recovers. The data for this period is usually removed or else the appropriate calibration data is applied. The Aerolaser instrument is not well insulated therefore is affected by sudden changes in temperature. Data when the laboratory temperature has changed rapidly during calibrations needs to be either removed or adjusted using calibration data which has been collected when the lab temperature is stable. Considering the treatment of outliers, data <40ppbV and >200ppbV are removed before submission to database. A concentration of 250 ppbv may indicate lab air leak. Picarro Data Treatment Calibration data is removed and the 4 second data is averaged into minute data. Zero and calibration data is applied and the data is averaged hourly. Considering the treatment of outliers. Invalidated data (flag3) includes data when % water content >5% without a nafion, or <0.3 or >0.5% when a nafion is on, CO2,CH4,H2O are equal to zero and data when CO2>460 or <400, CH4 <100. Data when CO > 250ppb indicates lab leak and so data is also invalidated at these times. Flag2 is used as a reduced quality data flag and includes data which is affected by local conditions (wind speed <2 m/s, 350>wind direction >100 degrees) |
|
|
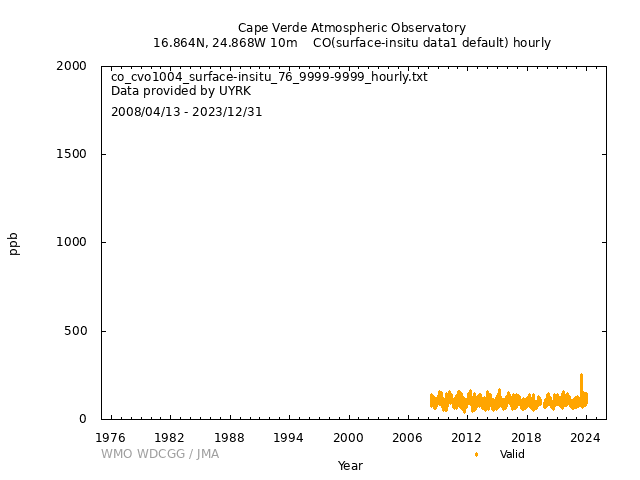
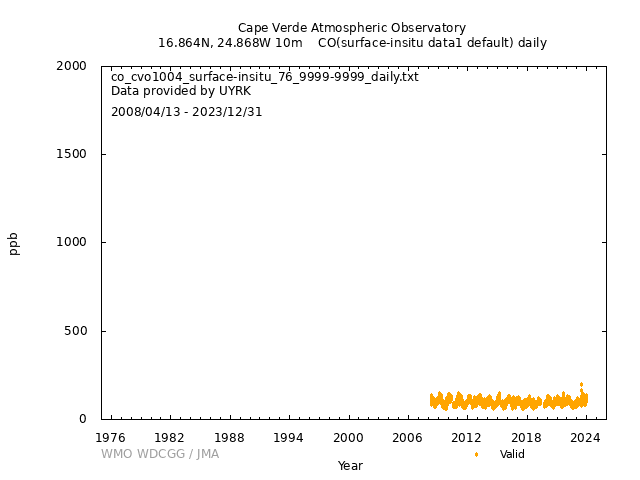
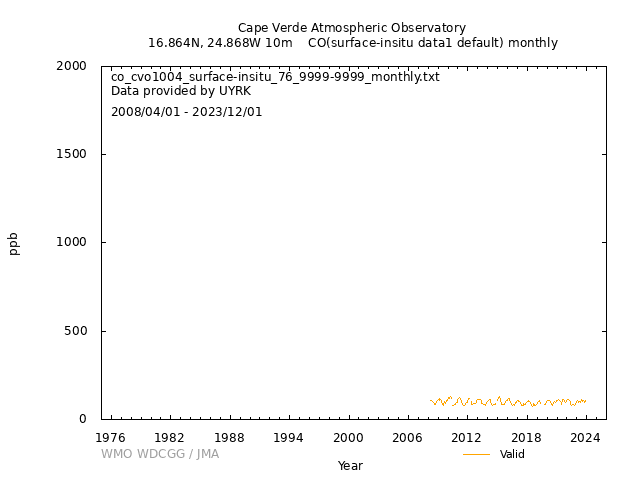
[Hourly] Zero, calibration and invalidated data is removed prior to averaging. Hourly data is obtained by averaging all the data within a 1 hour period for example between 00:00 - 01:00. Standard deviation and number of points used to obtain the average are provided. [Daily] Zero, calibration and invalidated data is removed prior to averaging. Daily data is obtained by averaging all the data within a 24 hour period for example between 01/01/14 00:00 - 02/01/2014 01:00. Standard deviation and number of points used to obtain the average are provided. [Monthly] Zero, calibration and invalidated data is removed prior to averaging. Daily data is obtained by averaging all the data within a 24 hour period for example between 01/01/14 00:00 - 01/02/2014 01:00. Standard deviation and number of points used to obtain the average are provided. |
|
|
Error Flag = 0 Good data Error Flag = 1 Reduced quality data Error Flag = 2 Below detection limit Error Flag = 3 Invalid or missing data |
|
|
Valid (background): 0 Valid: 1 Valid: 2 Invalid: 3 |
|
| Operational/Reporting | |
|
Aerolaser CO Measuring range: up to 100,000.00 ppbV Detection limit: < 0.80 ppbV at Integration time = 10 s Sensitivity: about 30 to 100 counts/ppbV Picarro CO Measuring range: 0 - 5 ppm Precision (5 sec / 5 min / 60 min, 1σ) 15 ppb /1.5 ppb / 1 ppb Max Drift at STP (over 24 hrs / 1 month) 10 ppb /50 ppb Max Uncertainty using Reference Gas (1 hr average, 2σ) < 2 ppb CO is sampled through 10m of 1" of teflon tubing followed by 3m of 1" stainless steel tubing and then finally 2m of 1/8" stainless steel tubing. The air passes through a nafion dryer (PERMAPURE) and a teflon filter before it enters the instrument. From August 2010, the stainless steel inlet was replaced with a 40mm diameter heated glass inlet. The air then passes through 2m of 1/8" stainless steel tubing. The air passes through a nafion dryer (PERMAPURE) and a teflon filter before it enters the instrument. Since June 2015, a new instrument was installed to measure CO. The Picarro G2401 (utilising Cavity Ringdown Spectroscopy) samples from the same manifold but the sample is not dried before entering the instrument. Since October 2019 the sample has been dried using a nafion drier as we have found that since a return to the manufacturer the water correction is now not acceptable. |
|
|
Wind direction: 1 Wind speed: 1 Relative humidity: 1 Precipitation amount: 0 Air pressure: 1 Air temperature: 1 Dew point temperature: 0 Sea water temperature: 0 Sea surface water temperature: 0 Sea water salinity: 0 Sea surface water salinity: 0 |
|
|
Meteorological data may remain as first provided, even when greenhouse gas data are updated. |
No DOI available
Related information
GAW Data Policy
"For Scientific purposes, access to these data is unlimited and provided without charge.
By their use you accept that an offer of co-authorship will be made through personal contact with the data providers
or owners whenever substantial use is made of their data.
In all cases, an acknowledgement must be made to the data providers or owners and to the data centre when these data are used within a publication."
Citation format
This format is an example of the WDCGG standard citation.
Please follow the citation format which the data providers or owners indicate.
Please follow the citation format which the data providers or owners indicate.
Katie Read (UYRK),
Lucy Carpenter (UYRK),
Atmospheric CO
at Cape Verde Atmospheric Observatory by University of York,
dataset published as CO_CVO1004_surface-insitu_UYRK_data1 at WDCGG,
ver. 2025-03-19-1326 (Reference date*: YYYY/MM/DD)
* As the reference date, please indicate the date you downloaded the files.
* As the reference date, please indicate the date you downloaded the files.
Reference(s)
| 1 | Read, K.A. et al., Extensive halogen-mediated ozone destruction over the tropical Atlantic Ocean, Nature, 453, 1232-1236, 2008. |
|---|---|
| 2 |
The designated world calibration centre for Carbon Monoxide: WCC-Empa (https://www.empa.ch/web/s503/wcc-empa), carries out regular audits of the measurements using travelling standards. For more information please see the report from the most recent of these audits: http://www.wmo.int/pages/prog/arep/gaw/documents/CVO_2012.pdf |
| 3 | Cape Verde Atmospheric Observatory Webpage: https://www.ncas.ac.uk/index.php/en/cvao-home |
| 4 | Read, K. A., J. D. Lee, A. C. Lewis, S. J. Moller, L. Mendes, and L. J. Carpenter, Intra-annual cycles of NMVOC in the tropical marine boundary layer and their use for interpreting seasonal variability in CO, J. Geophys. Res., 114, D21303, doi:10.1029/2009JD011879, 2009. |


