Data Policy
GAW Data Policy
"For Scientific purposes, access to these data is unlimited and provided without charge.
By their use you accept that an offer of co-authorship will be made through personal contact with the data providers
or owners whenever substantial use is made of their data.
In all cases, an acknowledgement must be made to the data providers or owners and to the data centre when these data are used within a publication."
Version
2026-01-22-1228 (Last updated: 2026-02-02)File
This data set is submitted by UBAG.
In line with the GAW Data Policy, users should contact the contributors of all data of interest and propose co-authorship or acknowledgement.
Organization
| NO | 71 |
|---|---|
| Acronym | UBAG |
| Name | German Environment Agency |
| Address 1 | Umweltbundesamt, Wörlitzer Platz 1, 06844 Dessau-Roßlau |
| Address 2 | Umweltbundesamt (Federal Environment Agency) FG II4.5, Air Monitoring Network, Paul-Ehrlich-Str. 29, 63225 Langen |
| Address 3 | |
| Country/Territory | Germany |
| Website | https://www.umweltbundesamt.de/gaw |
Contact(s)
| Name | Cedric Couret |
|---|---|
| Prefix | Ing. |
| cedric.couret@uba.de | |
| Organization No | 71 |
| Organization acronym | UBAG |
| Organization name | German Environment Agency |
| Organization country/territory | Germany |
| Address 1 | Umweltbundesamt, Umweltforschungsstation Schneefernerhaus, Zugspitze 5, 82475 Zugspitze |
| Address 2 | |
| Address 3 | |
| Country/territory | Germany |
| Tel | +498821924110 |
| Fax | |
| Last updated date | 2026-01-22 |
| Background observation | |
| UTC | |
| ppt | |
|
2002-01-01 00:00:00 - 9999-12-31 23:59:59: WMO SF6 X2014 |
|
|
2002-01-01 00:00:00 - 2024-12-31 23:59:59: Hewlett Packard Modified HP 6890 Chem. station, # US00030144(Gas chromatography (ECD)) 2025-01-01 00:00:00 - 9999-12-31 23:59:59: Agilent GC 8890, serial number #CN2323A011(Gas chromatography (ECD)) |
|
|
2001-01-01 00:00:00 - 9999-12-31 23:59:59: 3.00 (m) |
|
| 5 minutes | |
|
All data are based on NOAA/CMDL scale. Calibration gas: SF6 in natural air. Calibrations are carried out every 15 minutes using working standard tanks, which have been calibrated to a group of 6 NOAA station standards which envelope the atmospheric concentrations of SF6 |
|
|
Processing of GC Data With a software, called GC-Organizer, written by the team of I.Levin at University of Heidelberg the measured 5 min raw data are visually controlled in respect to outliers and the standard deviation during measurement of the standards. Outliers are removed with this graphical tool. After this pre-check 30 min atmospheric concentrations and standard deviation of CO2, CH4, SF6 and N2O are calculated with the same software program. Afterwards these 30 min data are imported with a self written software program, called Dafit (Description see: www.gawstat.de). The 30 min data are screened graphically. For a second validation, episodes of local pollution, also power failures, Instrument repairs etc. can be flagged. The digital log-book and if required, trajectories and co correlation with simultaneously measured data are used in to verify the CO2, CH4, N2O and SF6 data. Then from the flagged data for scientific purpose and export aggregation to 60min, 1day, 1month and 1year data is calculated in a standardized way for each, simultaneously also files with the WDCGG export format are produced in a standardized way to automate the workflow. |
|
|
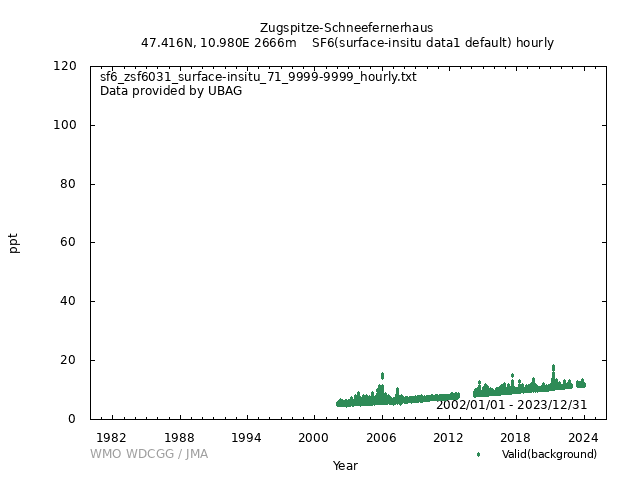
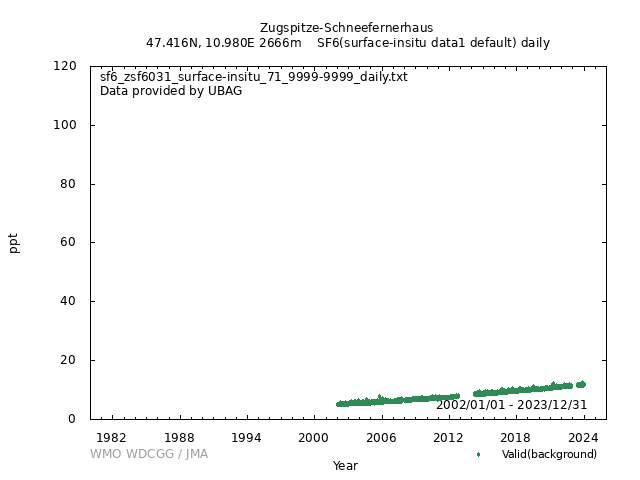
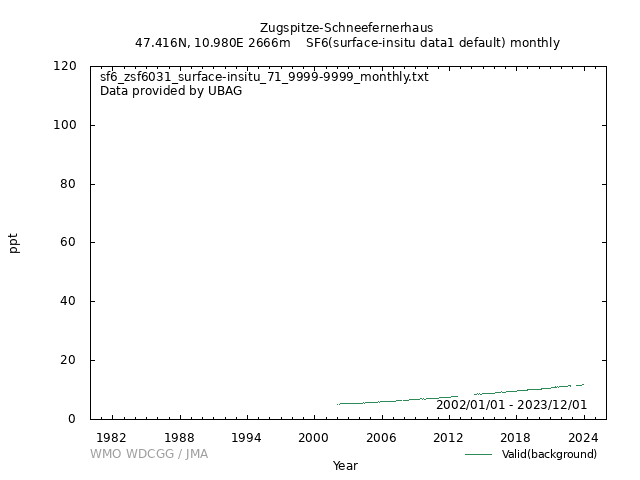
[Hourly] Mean Processing for the GC-data CO2, CH4, N2O and SF6 The data acquisition system provides one value every five minutes raw data. Zero/calibration factors and data protocols are used to convert raw data into calibrated data. Invalid data caused by local impact, malfunction or other effects are detected by comparison/ correlation with other trace substances and meteorological data and with information from the station logbook and then are rejected. 30 min mean values are generated by calculating the arithmetic mean of the remaining data. For reporting to WDCGG hourly mean values are calculated from these half hourly data. Until 2018: nvalue refers to the number of available 30min averages within the respective hour. From 2019: nvalue refers to the number of single measurements within the respective hour. [Daily] Mean Processing for the GC-data CO2, CH4, N2O and SF6 Daily mean values are generated by calculating the arithmetic mean of the available hourly data within the respective day. nvalue refers to the number of available hourly averages within the respective day. [Monthly] Mean Processing for the GC-data CO2, CH4, N2O and SF6 Monthly mean values are generated by calculating the arithmetic mean of the available daily data within the respective month. nvalue refers to the number of available daily averages within the respective month. |
|
|
1: Valid 3: Not Valid |
|
|
Valid (background): 1 Invalid: 3 |
|
| Operational/Reporting | |
|
Gas chromatography followed by electron capture detection Especially designed GC unit, project of university Heidelberg for Umweltbundesamt |
|
|
Wind direction: 1 Wind speed: 1 Relative humidity: 1 Precipitation amount: 0 Air pressure: 1 Air temperature: 1 Dew point temperature: 1 Sea water temperature: 0 Sea surface water temperature: 0 Sea water salinity: 0 Sea surface water salinity: 0 |
|
|
Meteorological data may remain as first provided, even when greenhouse gas data are updated. |
No DOI available
Related information
GAW Data Policy
"For Scientific purposes, access to these data is unlimited and provided without charge.
By their use you accept that an offer of co-authorship will be made through personal contact with the data providers
or owners whenever substantial use is made of their data.
In all cases, an acknowledgement must be made to the data providers or owners and to the data centre when these data are used within a publication."
Citation format
This format is an example of the WDCGG standard citation.
Please follow the citation format which the data providers or owners indicate.
Please follow the citation format which the data providers or owners indicate.
Cedric Couret (UBAG),
Atmospheric SF6
at Zugspitze-Schneefernerhaus by German Environment Agency,
dataset published as SF6_ZSF6031_surface-insitu_UBAG_data1 at WDCGG,
ver. 2026-01-22-1228 (Reference date*: YYYY/MM/DD)
* As the reference date, please indicate the date you downloaded the files.
* As the reference date, please indicate the date you downloaded the files.
Reference(s)
| 1 |
Report on the system and performance audit of Sulfur Hexafluoride Global GAW station Zugspitze- Schneefernerhaus (ZSF),Germany, November 2017 http://www.nims.go.kr/wcc/pdf/2.ZSF_Audit_report_2017.pdf |
|---|


