Data Policy
GAW Data Policy
"For Scientific purposes, access to these data is unlimited and provided without charge.
By their use you accept that an offer of co-authorship will be made through personal contact with the data providers
or owners whenever substantial use is made of their data.
In all cases, an acknowledgement must be made to the data providers or owners and to the data centre when these data are used within a publication."
Version
2025-01-01-0111 (Last updated: 2024-12-24)File
This data set is submitted by UBAG.
In line with the GAW Data Policy, users should contact the contributors of all data of interest and propose co-authorship or acknowledgement.
Organization
| NO | 71 |
|---|---|
| Acronym | UBAG |
| Name | German Environment Agency |
| Address 1 | Umweltbundesamt, Wörlitzer Platz 1, 06844 Dessau-Roßlau |
| Address 2 | Umweltbundesamt (Federal Environment Agency) FG II4.5, Air Monitoring Network, Paul-Ehrlich-Str. 29, 63225 Langen |
| Address 3 | |
| Country/Territory | Germany |
| Website | https://www.umweltbundesamt.de/gaw |
Contact(s)
| Name | Cedric Couret |
|---|---|
| Prefix | Ing. |
| cedric.couret@uba.de | |
| Organization No | 71 |
| Organization acronym | UBAG |
| Organization name | German Environment Agency |
| Organization country/territory | Germany |
| Address 1 | Umweltbundesamt, Umweltforschungsstation Schneefernerhaus, Zugspitze 5, 82475 Zugspitze |
| Address 2 | |
| Address 3 | |
| Country/territory | Germany |
| Tel | +498821924110 |
| Fax | |
| Last updated date | 2026-01-22 |
| Background observation | |
| UTC | |
| ppb | |
|
2002-01-01 00:00:00 - 9999-12-31 23:59:59: WMO CH4 X2004A |
|
|
2001-01-01 00:00:00 - 2011-12-31 22:59:59: Hewlett Packard Modified HP 6890 Chem. station, # US00030144(Gas chromatography (FID)) 2011-12-31 23:00:00 - 2014-12-31 22:59:59: Picarro Envirosense 3000i(CRDS) 2014-12-31 23:00:00 - 2015-12-31 22:59:59: Hewlett Packard Modified HP 6890 Chem. station, # US00030144(Gas chromatography (FID)) 2015-12-31 23:00:00 - 2024-03-31 23:59:59: Picarro G2301, ICOS #880(CRDS) 2022-01-01 00:00:00 - 9999-12-31 23:59:59: Picarro G2401, ICOS #1167(CRDS) |
|
|
2001-01-01 00:00:00 - 9999-12-31 23:59:59: 3.00 (m) |
|
| 1 minute | |
|
All data are based on WMO mole fraction scale. (NOAA/CMDL) Calibration of the GC Data CO2 and CH4: Calibration gas: CO2 in natural air. Calibrations are carried out every 15 minutes using working standard tanks, which have been calibrated by the use of a group of 6 NOAA station standards from the NOAA/CMDL Carbon Group for CO2 and CH4. The NOAA station standards envelope the actual atmospheric concentrations of CO2 and CH4 Current Scale: WMO mole fraction scale The usual sequence is sample,sample,standard. Each chromatogram takes 5 minutes GC Measurement data evaluation via Chemstation software. Calibration of the Picarro 2301 Data CO2 and CH4 until the 12th of January 2021: Calibration gas: CO2 and CH4 in natural air. The correction of the data is carried out every 8 hours using a short term standard tank. The short term tank is calibrated every 3 days by the use of 2 Standard tanks: 1 High and 1 low. The high and low standards are calibrated every 2 months by the use of a group of 4-6 NOAA station standards from the NOAA/CMDL Carbon Group. A target tank is measured every 3 days to detect any drift/issue. The NOAA station standards envelope the actual atmospheric concentrations of CO2 and CH4. Current Scale: WMO mole fraction scale From the 13th of January 2021, ICOS standard are used to calibrate the instruments. |
|
|
All values are quality controlled. Processing of GC Data With a software, called GC-Organizer, written by the team of I.Levin at University of Heidelberg the measured 5 min raw data are visually controlled in respect to outliers and the standard deviation during measurement of the standards. Outliers are removed with this graphical tool. After this pre-check 30 min atmospheric concentrations and standard deviation of CO2, CH4, SF6 and N2O are calculated with the same software program. Afterwards these 30 min data are imported with a self written software program, called Dafit (Description see: www.gawstat.de). The 30 min data are screened graphically. For a second validation, episodes of local pollution, also power failures, Instrument repairs etc. can be flagged. The digital log-book and if required, trajectories and co correlation with simultaneously measured data are used in to verify the CO2, CH4, N2O and SF6 data. Then from the flagged data for scientific purpose and export aggregation to 60min, 1day and 1month data is calculated in a standardized way for each, simultaneously also files with the WDCGG export format are produced in a standardized way to automate the workflow. Processing of Data from CRDS (Picarro, CO2, CH4 ) and QCL (Los Gatos, N2O, CO) The data acquisition system provides 1-minute averages of the raw data. 1 min data of sample and measurement of calibration gases are automatically retrieved and the data are automatically corrected. Calibration factors are used to convert 1-minute averages into calibrated 1-minute averages. With a self written software program, called Dafit (description see: www.gawstat.de) the data are imported. The data are visualized and artefacts, like spikes, room air, instrument repair, calibrations or mixed air data are flagged. After this step, hourly, daily and monthly means are calculated. Processing from 13.01.2021: Data processing at ICOS ATC is described in [Hazan et al., 2016], doi:10.5194/amt-9-4719-2016 |
|
|
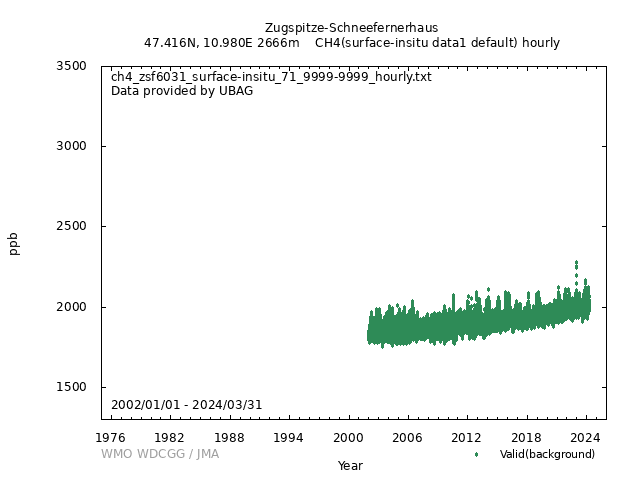
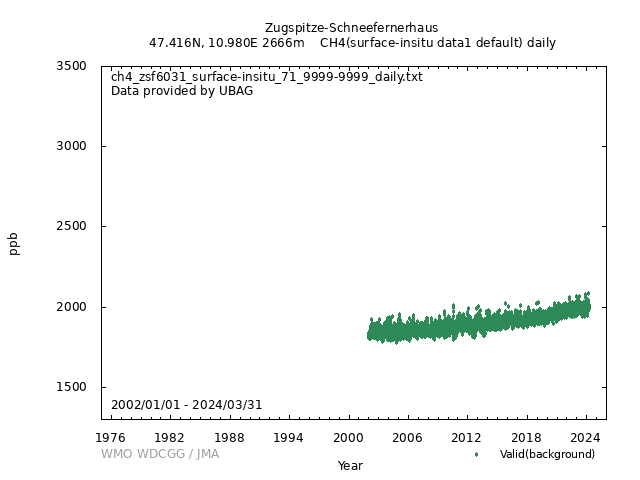
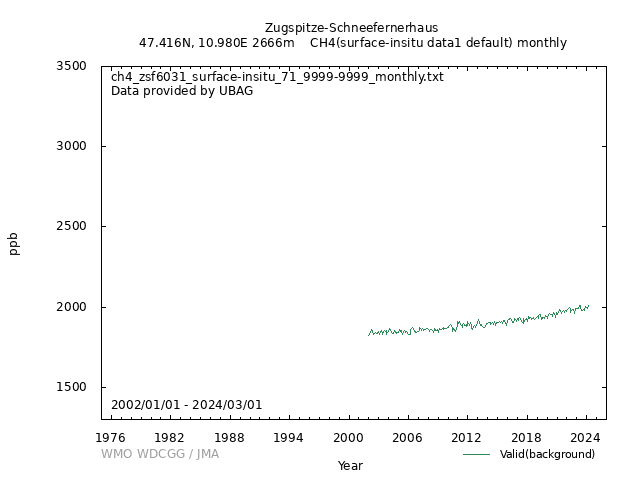
[Hourly] Mean Processing for the GC-data CO2, CH4, N2O and SF6 The data acquisition system provides one value every five minutes raw data. Zero/calibration factors and data protocols are used to convert raw data into calibrated data. Invalid data caused by local impact, malfunction or other effects are detected by comparison/ correlation with other trace substances and meteorological data and with information from the station logbook and then are rejected. 30 min mean values are generated by calculating the arithmetic mean of the remaining data. For reporting to WDCGG hourly mean values are calculated from these half hourly data. Mean Processing for the Picarro 2301 data CO2 and CH4 Hourly mean values are generated by calculating the arithmetic mean of the available data within the respective hour. nvalue refers to the number of available 1-minute averages within the respective hour. Mean Processing from 13.01.2021: Data processing at ICOS ATC is described in [Hazan et al., 2016], doi:10.5194/amt-9-4719-2016 [Daily] Mean Processing for the GC-data CO2, CH4, N2O and SF6 Daily mean values are generated by calculating the arithmetic mean of the available hourly data within the respective day. nvalue refers to the number of available hourly averages within the respective day. Mean Processing for the Picarro 2301 data CO2 and CH4 Daily mean values are generated by calculating the arithmetic mean of the available hourly data within the respective day. nvalue refers to the number of available hourly averages within the respective day. Mean Processing from 13.01.2021: Data processing at ICOS ATC is described in [Hazan et al., 2016], doi:10.5194/amt-9-4719-2016 [Monthly] Mean Processing for the GC-data CO2, CH4, N2O and SF6 Monthly mean values are generated by calculating the arithmetic mean of the available daily data within the respective month. nvalue refers to the number of available daily averages within the respective month. Mean Processing for the Picarro 2301 data CO2 and CH4 Monthly mean values are generated by calculating the arithmetic mean of the available daily data within the respective month. nvalue refers to the number of available daily averages within the respective month. Mean Processing from 13.01.2021 Data processing at ICOS ATC is described in [Hazan et al., 2016], doi:10.5194/amt-9-4719-2016 |
|
|
Until 12.01.2021, 1: Valid 3: Not Valid From 13.01.2021 Flag 'U' = data correct before manual quality control Flag 'N' = data incorrect before manual quality control Flag 'O' = data correct after manual quality control Flag 'K' = data incorrect after manual quality control Flag 'R' = data correct after manual quality control and backwards propagation Flag 'H' = data incorrect after manual quality control and backwards propagation |
|
|
Valid (background): 1 Invalid: 3 Valid (background): U Invalid: N Valid (background): O Invalid: K Valid (background): R Invalid: H |
|
| Operational/Reporting | |
|
Gas chromatography followed by flame ionisation detection (FID) especially designed GC unit, project of university Heidelberg for Umweltbundesamt |
|
|
Wind direction: 1 Wind speed: 1 Relative humidity: 1 Precipitation amount: 0 Air pressure: 1 Air temperature: 1 Dew point temperature: 1 Sea water temperature: 0 Sea surface water temperature: 0 Sea water salinity: 0 Sea surface water salinity: 0 |
|
|
Meteorological data may remain as first provided, even when greenhouse gas data are updated. |
No DOI available
Related information
GAW Data Policy
"For Scientific purposes, access to these data is unlimited and provided without charge.
By their use you accept that an offer of co-authorship will be made through personal contact with the data providers
or owners whenever substantial use is made of their data.
In all cases, an acknowledgement must be made to the data providers or owners and to the data centre when these data are used within a publication."
Citation format
This format is an example of the WDCGG standard citation.
Please follow the citation format which the data providers or owners indicate.
Please follow the citation format which the data providers or owners indicate.
Cedric Couret (UBAG),
Atmospheric CH4
at Zugspitze-Schneefernerhaus by German Environment Agency,
dataset published as CH4_ZSF6031_surface-insitu_UBAG_data1 at WDCGG,
ver. 2025-01-01-0111 (Reference date*: YYYY/MM/DD)
* As the reference date, please indicate the date you downloaded the files.
* As the reference date, please indicate the date you downloaded the files.
Reference(s)
| 1 |
System and Performance Audit of Surface Ozone, Carbon Monoxide, Methane, Carbon Dioxide and Nitrous Oxide at the Global GAW Station Zugspitze-Schneefernerhaus Germany, September 2020 https://library.wmo.int/doc_num.php?explnum_id=10747 |
|---|---|
| 2 | Data processing at ICOS ATC is described in [Hazan et al., 2016], doi:10.5194/amt-9-4719-2016 |


