Data Policy
GAW Data Policy
"For Scientific purposes, access to these data is unlimited and provided without charge.
By their use you accept that an offer of co-authorship will be made through personal contact with the data providers
or owners whenever substantial use is made of their data.
In all cases, an acknowledgement must be made to the data providers or owners and to the data centre when these data are used within a publication."
Version
2025-06-18-1121 (Last updated: 2025-07-01)File
This data set is submitted by SMNA.
In line with the GAW Data Policy, users should contact the contributors of all data of interest and propose co-authorship or acknowledgement.
Organization
| NO | 69 |
|---|---|
| Acronym | SMNA |
| Name | National Weather Service |
| Address 1 | Dorrego 4019, (C1425GBE) Ciudad Autónoma de Buenos Aires, Argentina. |
| Address 2 | |
| Address 3 | |
| Country/Territory | Argentina |
| Website | https://www.smn.gob.ar/ |
Contact(s)
| Name | Maria Emilia Ruiz |
|---|---|
| Prefix | |
| meruiz@smn.gob.ar | |
| Organization No | 69 |
| Organization acronym | SMNA |
| Organization name | National Weather Service |
| Organization country/territory | Argentina |
| Address 1 | Av. Dorrego 4019, (C1425GBE) Ciudad Autónoma de Buenos Aires |
| Address 2 | |
| Address 3 | |
| Country/territory | Argentina |
| Tel | |
| Fax | |
| Last updated date | 2025-08-18 |
| Name | Lino Condori |
|---|---|
| Prefix | |
| lcondori@smn.gov.ar | |
| Organization No | 69 |
| Organization acronym | SMNA |
| Organization name | National Weather Service |
| Organization country/territory | Argentina |
| Address 1 | Station GAW Ushuaia - International Airport “Malvinas Argentinas” – Ushuaia Tierra del Fuego – Argentina |
| Address 2 | |
| Address 3 | |
| Country/territory | Argentina |
| Tel | +54-11-51676767 |
| Fax | |
| Last updated date | 2025-08-18 |
| Background observation | |
| UTC | |
| ppm | |
|
9999-12-31 00:00:00 - 9999-12-31 23:59:59: WMO CO2 X2019 |
|
|
9999-12-31 00:00:00 - 9999-12-31 23:59:59: Picarro G2401 Serial number 3163-CFKADS-2307(CRDS) |
|
|
9999-12-31 00:00:00 - 9999-12-31 23:59:59: 7 (m) |
|
| 1 minute | |
|
Three calibration tanks consisting of CO2-in-natural-air mixtures with different concentrations are used. Air from each tank is measured for 18 minutes in the following order: high, low, and medium concentration, resulting in a total sequence of 54 minutes. A stabilization time of 9 minutes is considered for each tank. A calibration curve is then constructed using a linear fit. This sequence is repeated every 15 days. |
|
|
Raw data from the instrument are collected by the data acquisition system and stored at 1-minute intervals. Instrument performance is checked on site by an operator daily. The analyzer (Picarro G2401) is coupled to a custom-built automatic calibration unit. The sample air is dried prior to analysis using a Nafion dryer. The 1-minute raw data are inspected and evaluated using quality control routines before being accepted as valid measurements. These raw data are internally flagged for instrumental malfunctions, calibration sequences, target tank measurements, and abnormal (invalid) values such as outliers. |
|
|
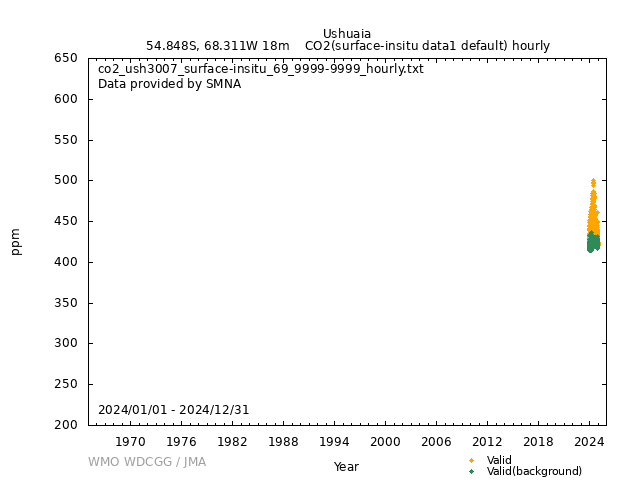
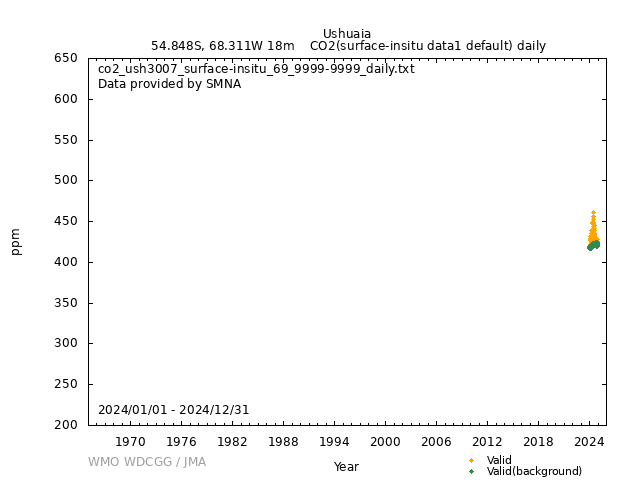
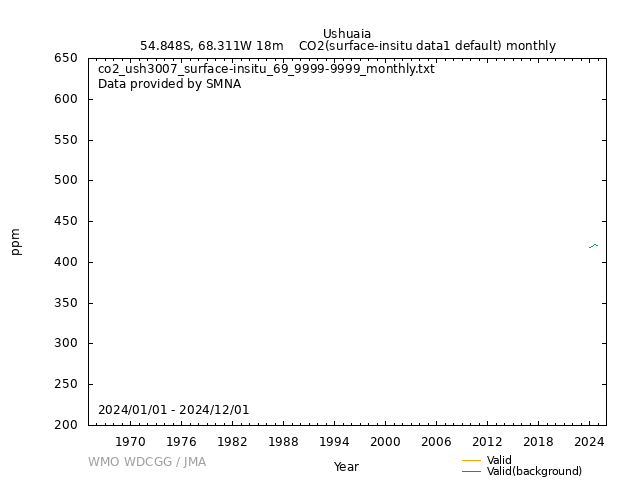
[Hourly] Calibration and invalidated 1-minute data are removed prior to averaging. Hourly averages are calculated as the arithmetic mean of valid, calibrated 1-minute data, and standard deviations are computed accordingly. A minimum number of valid 1-minute values is required within each hour for averaging. The minimum requirement is the availability of at least one-third of the expected 1-minute values per hour. – If between 20 and 60 valid 1-minute data points under background conditions are available, only those background values are averaged. The resulting hourly average is flagged as valid and identified as representative of background conditions. – If between 20 and 60 valid 1-minute ambient air data points (including both background and non-background conditions) are available, all valid values are averaged. The resulting hourly average is flagged as valid, but not representative of background conditions. – If neither of the above criteria is met, the hourly average is set to –999.999 and flagged as invalid. The hourly standard deviation is calculated as the sample standard deviation of the valid 1-minute values used in the hourly average. Background conditions are defined as periods when wind speed exceeds 2.5 m/s and wind direction is between 90° and 270°. [Daily] Daily averages are calculated from the hourly averages, applying similar considerations. The minimum requirement is the availability of 1/3 valid hourly averages within a single day. Standard deviation is calculated as the sample standard deviation of valid values within each averaging interval. For daily averages, daily standard deviation is computed from the hourly means used in the daily average [Monthly] Monthly averages are calculated from the daily averages, applying similar considerations. The minimum requirement is the availability of 1/3 valid daily averages within a single month. Standard deviation is calculated as the sample standard deviation of valid values within each averaging interval. |
|
|
Valid (background): 1 Valid: 2 Invalid: 3 |
|
| Operational/Reporting | |
|
Wind direction: Wind speed: Relative humidity: Precipitation amount: Air pressure: Air temperature: Dew point temperature: Sea water temperature: Sea surface water temperature: Sea water salinity: Sea surface water salinity: |
|
|
Meteorological data may remain as first provided, even when greenhouse gas data are updated. |
No DOI available
Related information
| Format | Text (WDCGG Data Format Table, WDCGG Meteorological Data Format Table), NetCDF | ||||
|---|---|---|---|---|---|
| Relation List (Is Part Of) |
All CO2 data contributed to WDCGG by GAW stations and mobiles by 2025-09-17 |
||||
| Geolocation Point |
|
GAW Data Policy
"For Scientific purposes, access to these data is unlimited and provided without charge.
By their use you accept that an offer of co-authorship will be made through personal contact with the data providers
or owners whenever substantial use is made of their data.
In all cases, an acknowledgement must be made to the data providers or owners and to the data centre when these data are used within a publication."
Citation format
This format is an example of the WDCGG standard citation.
Please follow the citation format which the data providers or owners indicate.
Please follow the citation format which the data providers or owners indicate.
Maria Emilia Ruiz (SMNA),
Lino Condori (SMNA),
Atmospheric CO2
at Ushuaia by National Weather Service,
dataset published as CO2_USH3007_surface-insitu_SMNA_data1 at WDCGG,
ver. 2025-06-18-1121 (Reference date*: YYYY/MM/DD)
* As the reference date, please indicate the date you downloaded the files.
* As the reference date, please indicate the date you downloaded the files.


