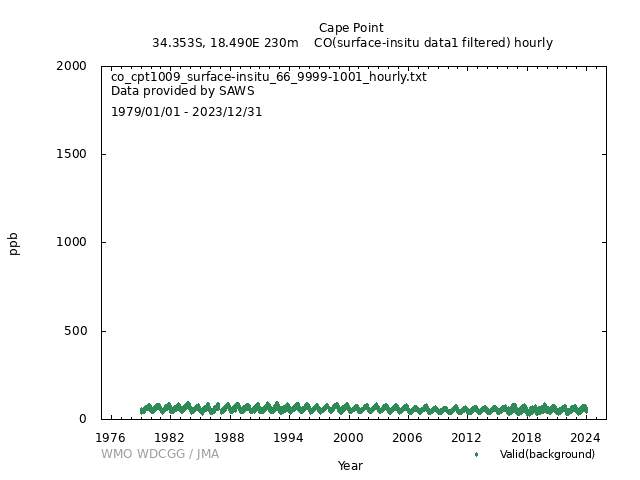
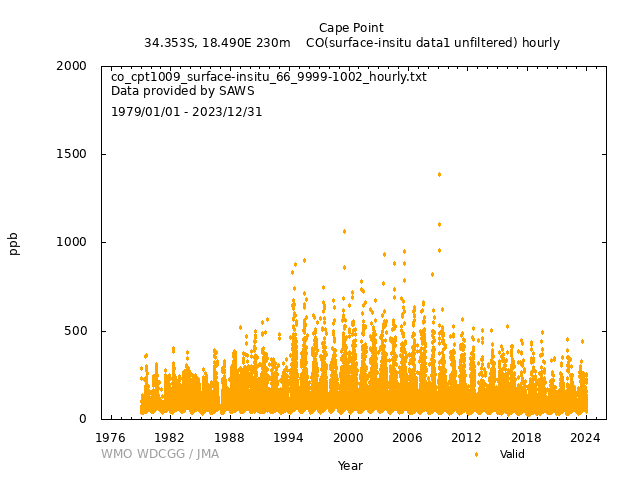
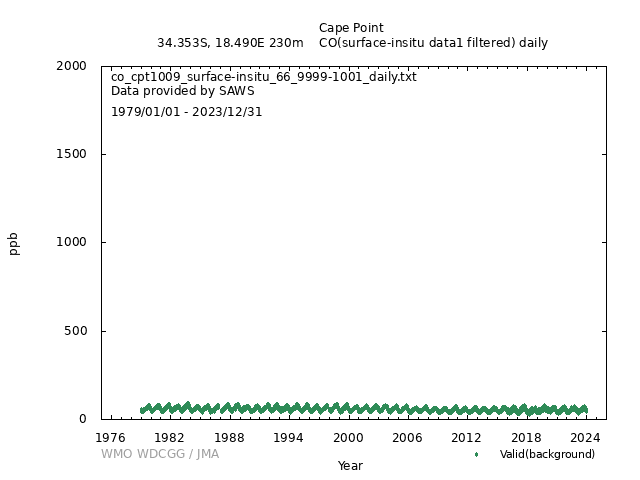
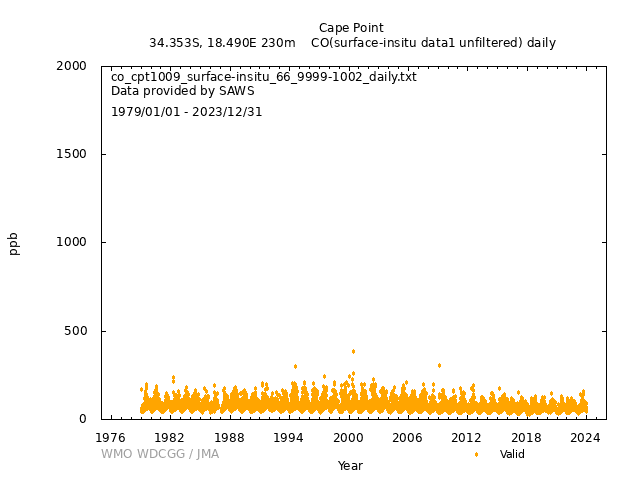
Data Policy
GAW Data Policy
"For Scientific purposes, access to these data is unlimited and provided without charge.
By their use you accept that an offer of co-authorship will be made through personal contact with the data providers
or owners whenever substantial use is made of their data.
In all cases, an acknowledgement must be made to the data providers or owners and to the data centre when these data are used within a publication."
Version
2025-03-31-1305 (Last updated: 2025-07-30)File
This data set is submitted by SAWS.
In line with the GAW Data Policy, users should contact the contributors of all data of interest and propose co-authorship or acknowledgement.
Organization
| NO | 66 |
|---|---|
| Acronym | SAWS |
| Name | South African Weather Service |
| Address 1 | South African Weather Service - GAW, |
| Address 2 | Freight Road, Oval Park Office, |
| Address 3 | Cape Town Int Airport, 7525 |
| Country/Territory | South Africa |
| Website | http://www.weathersa.co.za/ |
Contact(s)
| Name | Casper Labuschagne |
|---|---|
| Prefix | Mr |
| Casper.labuschagne@weathersa.co.za | |
| Organization No | 66 |
| Organization acronym | SAWS |
| Organization name | South African Weather Service |
| Organization country/territory | South Africa |
| Address 1 | South African Weather Service - GAW, |
| Address 2 | Freight Road, Oval Park Office, |
| Address 3 | Cape Town Int Airport, 7525 |
| Country/territory | South Africa |
| Tel | |
| Fax | |
| Last updated date | 2025-08-18 |
| Background observation | |
| UTC+02:00 | |
| ppb | |
|
9999-12-31 00:00:00 - 9999-12-31 23:59:59: WMO CO X2014A |
|
|
9999-12-31 00:00:00 - 2014-12-31 23:59:59: RGA3 Trace Analytical(Gas chromatography (RGD)) 2015-01-01 00:00:00 - 9999-12-31 23:59:59: Picarro G2302(CRDS) |
|
|
9999-12-31 00:00:00 - 9999-12-31 23:59:59: 30 (m) |
|
| 1 minute | |
|
Historically: Calibrations are automatically performed every two hours and the target gas determination once daily. Currently: Daily target gas to track intrumental drift (if any); Bi-annual analysis of 6x NOAA laboratory standards; Monthly determination of 4x secondary standards for calibration line verification; Quarterly 5x NOAA laboratory standards to determine calibration line function; Annually, a review of the 4 quarterly calibrations via a rolling average |
|
|
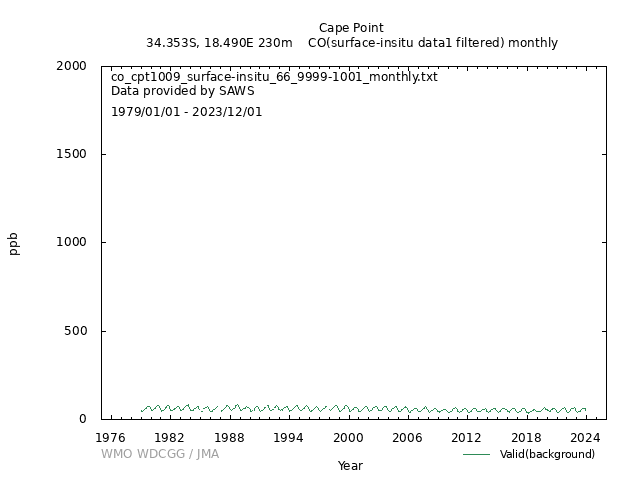
All data with obvious sampling or analytical error are rejected. Furthermore, a statistical filter (moving percentiles) is applied for the selection of background concentrations. Data selection applied to the "all data set" (based on statistical filtering)are done as follows: Two 11-day moving percentiles are applied to the data. The two freely selectable percentiles, each tuneable by a factor, serve as upper and lower cut-off limits for background concentration selection. Calibration data are omitted from final reported data set. |
|
|
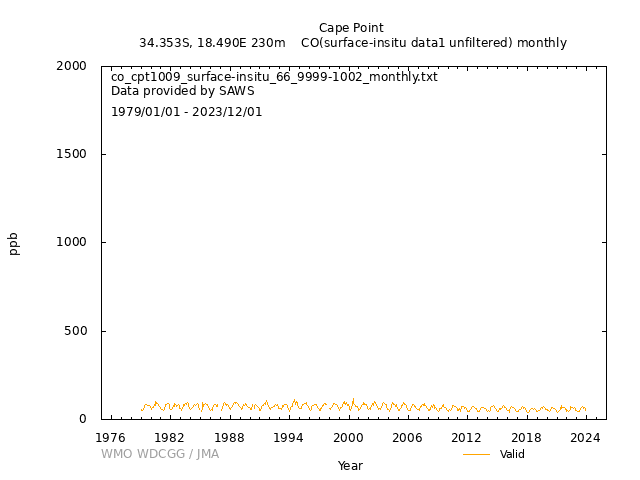
[Hourly] Historically (1978 - 2011): 15min data averaged to 30min reported values; i.e. preceding 2 values constitutes a value at xx:30 (00:00 - 00:30 value reported at 00:30) Currently (2011 - present): 1-min high freq. data averaged to 30-min reported values; i.e. preceding 30 values constitutes a value at xx:30 (00:00 - 00:30 value reported at 00:30) [Daily] [Monthly] |
|
| All data reported are valid. Invalid data & Calibrations have been removed from final reported data sets. | |
|
Valid: 2 |
|
| Operational/Reporting | |
|
Scientific Aim : Long-term measurements of tropospheric CO representative of air masses advected from the SW Atlantic ocean. GC in combination with AAS The height of the ambient air intake is 260 m above sea level from the top of a 30 m high mast. Two freezing units (-4 and -45 °C respectively) are used in series to dry the ambient air prior to analysis. 30-metre 1/4 inch stainless steel air intake |
|
|
Wind direction: 1 Wind speed: 1 Relative humidity: 1 Precipitation amount: 1 Air pressure: 1 Air temperature: 1 Dew point temperature: 0 Sea water temperature: 0 Sea surface water temperature: 0 Sea water salinity: 0 Sea surface water salinity: 0 |
|
|
Meteorological data may remain as first provided, even when greenhouse gas data are updated. WS & WD is value reported on the hour (i.e. not 10min average); anemometer height same as GHG intake height. |
DOI Metadata
| DOI |
|
||||||||||||||||||||||||||||||||
|---|---|---|---|---|---|---|---|---|---|---|---|---|---|---|---|---|---|---|---|---|---|---|---|---|---|---|---|---|---|---|---|---|---|
| Version |
2025-03-31-1305 (Data Version History) * DOIs and file names may have multiple versions. Be sure to check the data version. |
||||||||||||||||||||||||||||||||
| Title | Atmospheric CO at Cape Point by South African Weather Service, dataset published as CO_CPT1009_surface-insitu_SAWS_data1 at WDCGG | ||||||||||||||||||||||||||||||||
| Creator |
South African Weather Service Casper Labuschagne (SAWS) |
||||||||||||||||||||||||||||||||
| Publisher | World Data Centre for Greenhouse Gases | ||||||||||||||||||||||||||||||||
| Publication Date | 2018-08-21 (Last Updated: 2025-07-30) | ||||||||||||||||||||||||||||||||
| Format | Text (WDCGG Data Format Table, WDCGG Meteorological Data Format Table), NetCDF | ||||||||||||||||||||||||||||||||
| Relation List (Is Part Of) |
All CO data contributed to WDCGG by GAW stations and mobiles by 2025-09-17 All CO data contributed to WDCGG by GAW stations and mobiles by 2024-09-24 All CO data contributed to WDCGG by GAW stations and mobiles by 2023-09-13 All CO data contributed to WDCGG by GAW stations and mobiles by 2022-09-05 All CO data contributed to WDCGG by GAW stations and mobiles by 2021-08-27 All CO data contributed to WDCGG by GAW stations and mobiles by 2020-09-28 All CO data contributed to WDCGG by GAW stations and mobiles by 2019-09-19 All CO data contributed to WDCGG by GAW stations and mobiles by 2018-10-25 |
||||||||||||||||||||||||||||||||
| Geolocation Point |
|
GAW Data Policy
"For Scientific purposes, access to these data is unlimited and provided without charge.
By their use you accept that an offer of co-authorship will be made through personal contact with the data providers
or owners whenever substantial use is made of their data.
In all cases, an acknowledgement must be made to the data providers or owners and to the data centre when these data are used within a publication."
Citation format
This format is an example of the WDCGG standard citation.
Please follow the citation format which the data providers or owners indicate.
Please follow the citation format which the data providers or owners indicate.
Casper Labuschagne (SAWS),
Atmospheric CO
at Cape Point by South African Weather Service,
dataset published as CO_CPT1009_surface-insitu_SAWS_data1 at WDCGG,
ver. 2025-03-31-1305, https://doi.org/10.50849/WDCGG_0066-1009-3001-01-01-9999 (Reference date*: YYYY/MM/DD)
* As the reference date, please indicate the date you downloaded the files.
* As the reference date, please indicate the date you downloaded the files.


