Data Policy
GAW Data Policy
"For Scientific purposes, access to these data is unlimited and provided without charge.
By their use you accept that an offer of co-authorship will be made through personal contact with the data providers
or owners whenever substantial use is made of their data.
In all cases, an acknowledgement must be made to the data providers or owners and to the data centre when these data are used within a publication."
Version
2025-01-01-0106 (Last updated: 2024-12-24)File
This data set is submitted by SAWS.
In line with the GAW Data Policy, users should contact the contributors of all data of interest and propose co-authorship or acknowledgement.
Organization
| NO | 66 |
|---|---|
| Acronym | SAWS |
| Name | South African Weather Service |
| Address 1 | South African Weather Service - GAW, |
| Address 2 | Freight Road, Oval Park Office, |
| Address 3 | Cape Town Int Airport, 7525 |
| Country/Territory | South Africa |
| Website | http://www.weathersa.co.za/ |
Contact(s)
| Name | Thumeka Mkololo |
|---|---|
| Prefix | Dr |
| thumeka.mkololo@weathersa.co.za | |
| Organization No | 66 |
| Organization acronym | SAWS |
| Organization name | South African Weather Service |
| Organization country/territory | South Africa |
| Address 1 | South African Weather Service - GAW, |
| Address 2 | Freight Road, Oval Park Office, |
| Address 3 | Cape Town Int Airport, 7525 |
| Country/territory | South Africa |
| Tel | |
| Fax | |
| Last updated date | 2023-11-28 |
| Name | Lynwill Martin |
|---|---|
| Prefix | |
| Lynwill.martin@weathersa.co.za | |
| Organization No | 66 |
| Organization acronym | SAWS |
| Organization name | South African Weather Service |
| Organization country/territory | South Africa |
| Address 1 | South African Weather Service - GAW, |
| Address 2 | Freight Road, Oval Park Office, |
| Address 3 | Cape Town Int Airport, 7525 |
| Country/territory | South Africa |
| Tel | |
| Fax | |
| Last updated date | 2023-11-28 |
| Background observation | |
| UTC+02:00 | |
| ppb | |
|
9999-12-31 00:00:00 - 2006-12-31 23:59:59: SHIMADZU GC-ECD(Gas chromatography (ECD)) 2007-01-01 00:00:00 - 9999-12-31 23:59:59: HP 5890(Gas chromatography (ECD)) |
|
|
9999-12-31 00:00:00 - 9999-12-31 23:59:59: 30 (m) |
|
| 15 minutes | |
| One working standard is used every hour and multi calibrations involving five (CMDL certified) laboratory standards (range: 286 - 347 ppb N2O) are utilised approximately once every 4 months to verify the working gas concentration. A target gas is also run once daily as a check on instrumental stability. | |
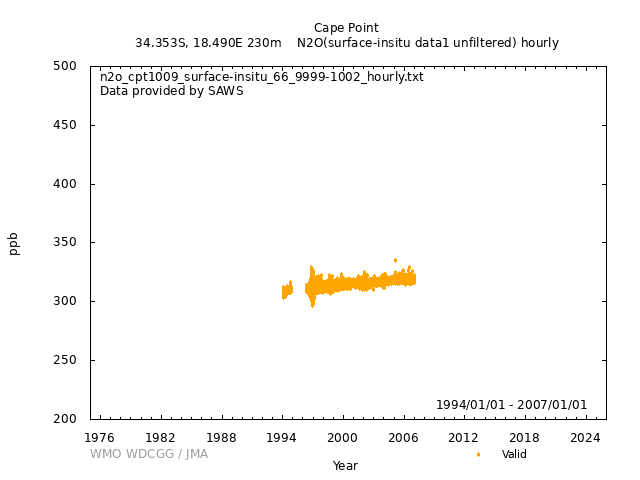
| All data with obvious sampling or analytical error are rejected. Furthermore, a statistical filter (moving percentiles) is applied for the selection of background concentrations. Calibrations are removed from final reported data set. | |
|
[Hourly] [Daily] [Monthly] |
|
| Temporarily suspended | |
|
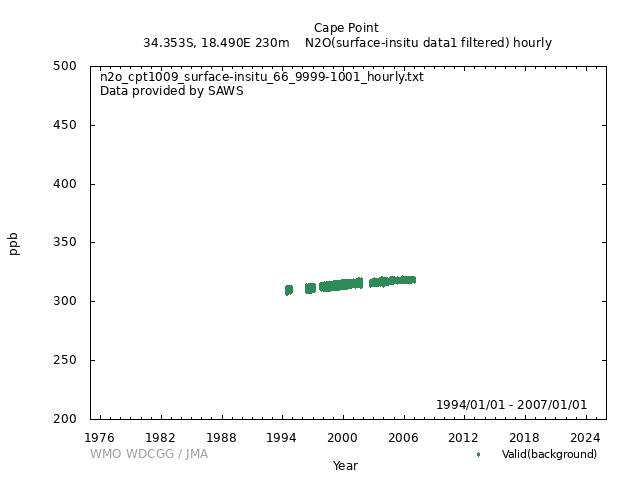
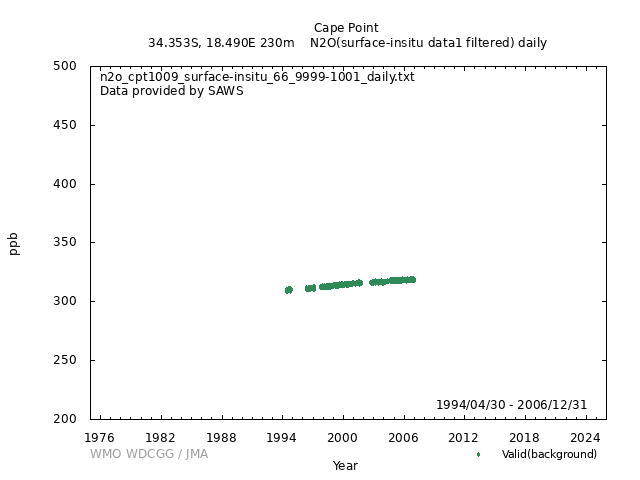
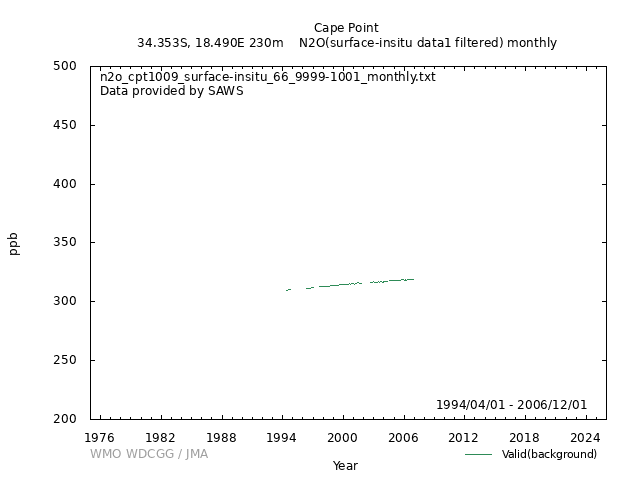
Scientific Aim : Observation of long-term N2O trends in maritime air representative of the Southern Hemispheric mid-latitudes. Research related to baseline N2O levels and deducing N2O sources and sinks. Two freezing units (-4 and -45 °C respectively) are used in series to dry the ambient air prior to analysis. Sampling is continuous, using a gas chromatograph (GC) with and Electron Capture Detector (ECD). The oven temperature is approximately 40 °C and the ECD temperature 355 oC. The primary column is a 1/8" x 3 m stainless steel, packed with Porapak N, 80/100 mesh, whilst a pre-column (1/4" x 20 cm s/steel packed with sodium asbestos) is used to extract any CO2. N2 (5.0) is used as carrier gas and the sampling loop (s/steel, 2 mm OD x 2.2 m) has a volume of 7 ml. The data have been recorded at 15 min intervals (96 samples per day) and mixing ratios stored as hourly means (1994 until 2002). From mid-99 onwards, the 15-min intervals have been used to create half-hourly means. These in turn form the basis for the daily and monthly averages. The height of the air intake is 260 m above sea level from the top of a 30 m high mast. |
|
|
Wind direction: Wind speed: Relative humidity: Precipitation amount: Air pressure: Air temperature: Dew point temperature: Sea water temperature: Sea surface water temperature: Sea water salinity: Sea surface water salinity: |
|
|
Meteorological data may remain as first provided, even when greenhouse gas data are updated. |
No DOI available
Related information
GAW Data Policy
"For Scientific purposes, access to these data is unlimited and provided without charge.
By their use you accept that an offer of co-authorship will be made through personal contact with the data providers
or owners whenever substantial use is made of their data.
In all cases, an acknowledgement must be made to the data providers or owners and to the data centre when these data are used within a publication."
Citation format
This format is an example of the WDCGG standard citation.
Please follow the citation format which the data providers or owners indicate.
Please follow the citation format which the data providers or owners indicate.
Thumeka Mkololo (SAWS),
Lynwill Martin (SAWS),
Atmospheric N2O
at Cape Point by South African Weather Service,
dataset published as N2O_CPT1009_surface-insitu_SAWS_data1 at WDCGG,
ver. 2025-01-01-0106 (Reference date*: YYYY/MM/DD)
* As the reference date, please indicate the date you downloaded the files.
* As the reference date, please indicate the date you downloaded the files.
Reference(s)
| 1 | Brunke E-G. Scheel H.E. and Seiler W. (1990). Trends of tropospheric CO, N2O and CH4 as observed at Cape Point, South Africa. Atmos. Environ. 24A, 3, 585-595. |
|---|---|
| 2 | Scheel H.E., Brunke E-G. and Seiler W. (1990). Trace gas measurements at the Monitoring Station Cape Point, South Africa, between 1978 and 1988. J. Atmos. Chem. 11, 3, 197-210. |


