Data Policy
GAW Data Policy
"For Scientific purposes, access to these data is unlimited and provided without charge.
By their use you accept that an offer of co-authorship will be made through personal contact with the data providers
or owners whenever substantial use is made of their data.
In all cases, an acknowledgement must be made to the data providers or owners and to the data centre when these data are used within a publication."
Version
2025-06-30-0404 (Last updated: 2025-07-28)File
This data set is submitted by NIWA.
In line with the GAW Data Policy, users should contact the contributors of all data of interest and propose co-authorship or acknowledgement.
Organization
| NO | 57 |
|---|---|
| Acronym | NIWA |
| Name | National Institute of Water & Atmospheric Research Ltd. |
| Address 1 | NIWA - Wellington |
| Address 2 | Private Bag 14901, Kilbirnie, Wellington, 6241 |
| Address 3 | 301 Evans Bay Parade, Hataitai, Wellington 6021 |
| Country/Territory | New Zealand |
| Website | http://www.niwa.co.nz |
Contact(s)
| Name | Sylvia Nichol |
|---|---|
| Prefix | |
| sylvia.nichol@niwa.co.nz | |
| Organization No | 57 |
| Organization acronym | NIWA |
| Organization name | National Institute of Water & Atmospheric Research Ltd. |
| Organization country/territory | New Zealand |
| Address 1 | |
| Address 2 | |
| Address 3 | |
| Country/territory | New Zealand |
| Tel | |
| Fax | |
| Last updated date | 2025-07-18 |
| Name | Dan Smale |
|---|---|
| Prefix | |
| dan.smale@niwa.co.nz | |
| Organization No | 57 |
| Organization acronym | NIWA |
| Organization name | National Institute of Water & Atmospheric Research Ltd. |
| Organization country/territory | New Zealand |
| Address 1 | |
| Address 2 | |
| Address 3 | |
| Country/territory | New Zealand |
| Tel | |
| Fax | |
| Last updated date | 2025-06-30 |
| Background observation | |
| UTC+12:00 | |
| ppb | |
|
9999-12-31 00:00:00 - 9999-12-31 23:59:59: WMO CO X2014A |
|
|
9999-12-31 00:00:00 - 9999-12-31 23:59:59: University of Wollongong (Australia) in-situ mid-infrared Fourier transform spectrometer(Mid-FTIR) |
|
|
9999-12-31 00:00:00 - 9999-12-31 23:59:59: 10 (m) |
|
| event | |
|
The IFTS data is calibrated to the NOAA/WMO scale via daily measurements of one working standard. The working tank is baseline air sampled from the Baring Head station (Wellington, New Zealand) in clean conditions. The working tank is filled to 2000PSI. The New Zealand regional scale transfer reference (NZRSTF) gas suite is located at NIWA GASLAB (Greta point, Wellington) which are calibrated on the NOAA/WMO scale. The carbon monoxide in the working tank is measured with Gas Chromatography cold vapor atomic fluorescence spectrometry and calibrated against the NZRSTF suite. Once the working tank pressure drops to 500psi the tank is sent back to NIWA GASLAB for re-measurement to ascertain drift. A new working tank is required every 1.5 years. Since May 2009 flask samples have been collected on a routine (weekly) basis. These additional measurements were added to provide verification and validation of the IFTS measurements (Smale, 2018). The comparison shows a −0.43 ppb bias (with a 1 sigma SD of 1.60 ppb) in the IFTS measurements. This bias is not seasonally dependent and within the GAW network comparability recommended limit of ±2 ppb (GAW, 2016). |
|
|
Both sample and working tank gas measurements are first converted to dry mole fractions (Hammer ,2013). An empirically derived Residual pressure sensitivity (RPS) term (Hammer,2013) is then applied to the sample data. The magnitude of which is proportional to the pressure difference between the sample and average calibration pressure. The Lauder CO IFTS RPS coefficient used is 0.0009 [ppb hPa-1], less than that of 0.006 as measured in Hammer (2013). The ASF is then applied to the RPS corrected samples. Drift in WS CO composition (Novelli, 1991; Andrews, 2014) is also a cause for concern and manifests itself in scale factor drift. If left uncorrected incorrect calibration of sample measurements occurs. Drift can be identified whilst the WS is in current use by a gradual increase in the scale factor, but only confirmed and quantified once the tank is returned to the calibration centre and remeasured. Thus, final sample calibration can only be achieved after WS re-measurement. CO drift is linearly parameterised and accounted for in the scale factor calculation. If drift correction is not taken into account, there will be an artificial downward trend in the calibrated sample CO measurements. The corrected and calibrated samples along with drift corrected working tank calibrations are then passed through a quality control and quality assurance process (Smale, 2018). Instrument and retrieval diagnostics are used to screen the data. Data taken during erroneous instrument operation are discounted. Analysis of the monthly diurnal cycle at the Lauder site shows a minimum variability in the mid-afternoon in all months (Appendix D, Smale, 2018). We consider the hourly mean value from 15:00-16:00 NZST when the mean wind speed is greater than 5 m/s. We assume these data are representative of CO mixing ratios within a well-mixed planetary boundary layer and/or spatial scales that can be adequately represented in atmospheric models. We label such data as ‘Baseline’. Baseline data is submitted to the WDCGG. |
|
|
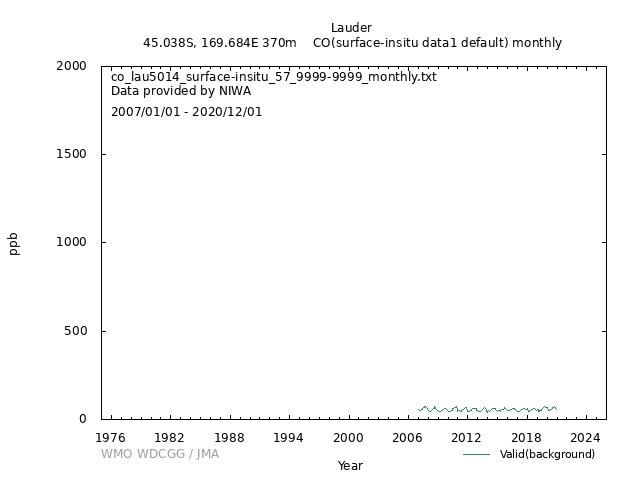
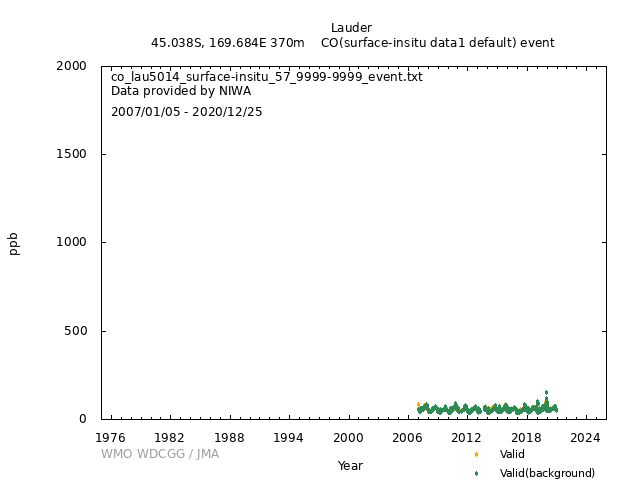
[Hourly] The data submitted are hourly averages comprising of 10 minute measurements made within the hour. A minimum of three 10 minute measurements are required to construct a valid hourly value. [Daily] [Monthly] |
|
| Wind condition flag =1 if wind speed > 5 m/s for the entire hour, otherwise flag = 2. | |
| Operational/Reporting | |
|
Wind direction: 1 Wind speed: 1 Relative humidity: 0 Precipitation amount: 0 Air pressure: 0 Air temperature: 0 Dew point temperature: 0 Sea water temperature: 0 Sea surface water temperature: 0 Sea water salinity: 0 Sea surface water salinity: 0 |
|
|
Meteorological data may remain as first provided, even when greenhouse gas data are updated. |
No DOI available
Related information
| Format | Text (WDCGG Data Format Table, WDCGG Meteorological Data Format Table), NetCDF | ||||
|---|---|---|---|---|---|
| Relation List (Is Part Of) |
All CO data contributed to WDCGG by GAW stations and mobiles by 2025-09-17 All CO data contributed to WDCGG by GAW stations and mobiles by 2024-09-24 All CO data contributed to WDCGG by GAW stations and mobiles by 2023-09-13 All CO data contributed to WDCGG by GAW stations and mobiles by 2022-09-05 All CO data contributed to WDCGG by GAW stations and mobiles by 2021-08-27 All CO data contributed to WDCGG by GAW stations and mobiles by 2020-09-28 All CO data contributed to WDCGG by GAW stations and mobiles by 2019-09-19 |
||||
| Geolocation Point |
|
GAW Data Policy
"For Scientific purposes, access to these data is unlimited and provided without charge.
By their use you accept that an offer of co-authorship will be made through personal contact with the data providers
or owners whenever substantial use is made of their data.
In all cases, an acknowledgement must be made to the data providers or owners and to the data centre when these data are used within a publication."
Citation format
This format is an example of the WDCGG standard citation.
Please follow the citation format which the data providers or owners indicate.
Please follow the citation format which the data providers or owners indicate.
Sylvia Nichol (NIWA),
Dan Smale (NIWA),
Atmospheric CO
at Lauder by National Institute of Water & Atmospheric Research Ltd.,
dataset published as CO_LAU5014_surface-insitu_NIWA_data1 at WDCGG,
ver. 2025-06-30-0404 (Reference date*: YYYY/MM/DD)
* As the reference date, please indicate the date you downloaded the files.
* As the reference date, please indicate the date you downloaded the files.
Reference(s)
| 1 | Zellweger et al., System and Performance Audit of Surface Ozone, Methane, Carbon Dioxide, Nitrous Oxide and Carbon Monoxide at the Global GAW Station Lauder, New Zealand, November 2016,WCC-Empa Report 16/5, available at: https://www.wmo.int/pages/prog/arep/gaw/documents/LAU_2016.pdf |
|---|---|
| 2 | Smale, D., Sherlock, V., Griffith, D. W. T., Moss, R., Brailsford, G., Nichol, S., and Kotkamp, M.: A decade of CH4, CO and N2O in situ measurements at Lauder, New Zealand: assessing the long-term performance of a Fourier transform infra-red trace gas and isotope analyser, Atmos. Meas. Tech., https://doi.org/10.5194/amt-2018-274 |
| 3 | Zellweger et al., System and Performance Audit of 5 Surface Ozone, Methane, Carbon Dioxide, Nitrous Oxide and Carbon Monoxide at the Global GAW Station Lauder, New Zealand, March 2010,WCC-Empa Report 10/3, available at: https://www.wmo.int/pages/prog/arep/gaw/documents/LAU_2010.pdf |


