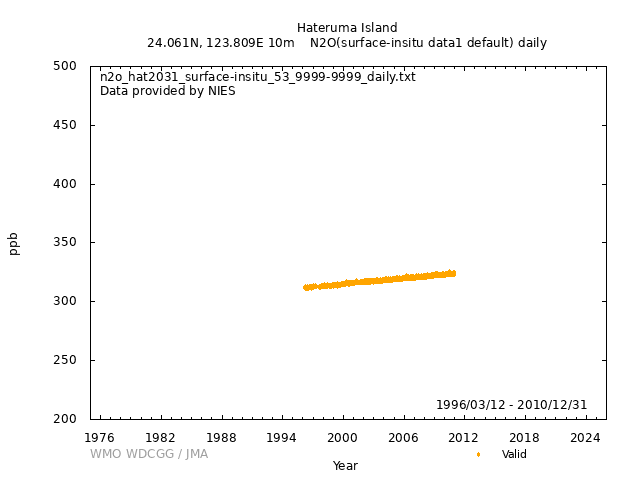
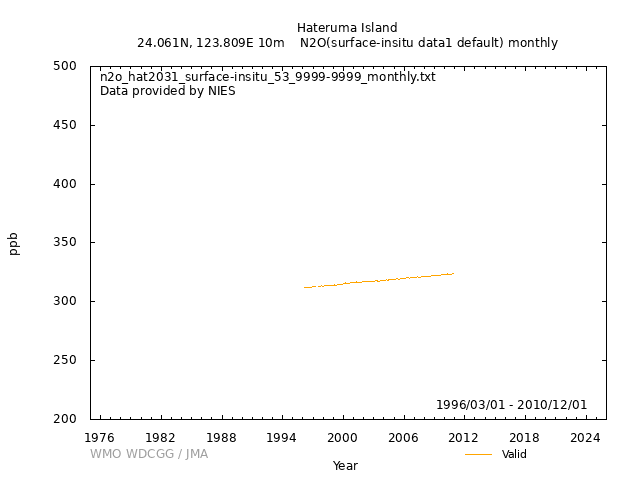
Data Policy
GAW Data Policy
"For Scientific purposes, access to these data is unlimited and provided without charge.
By their use you accept that an offer of co-authorship will be made through personal contact with the data providers
or owners whenever substantial use is made of their data.
In all cases, an acknowledgement must be made to the data providers or owners and to the data centre when these data are used within a publication."
Version
2025-01-01-0053 (Last updated: 2024-12-24)File
This data set is submitted by NIES.
In line with the GAW Data Policy, users should contact the contributors of all data of interest and propose co-authorship or acknowledgement.
Organization
| NO | 53 |
|---|---|
| Acronym | NIES |
| Name | National Institute for Environmental Studies |
| Address 1 | |
| Address 2 | National Institute for Environmental Studies |
| Address 3 | 16-2 Onogawa, Tsukuba 305-8506, Japan |
| Country/Territory | Japan |
| Website | https://www.nies.go.jp/index-e.html |
Contact(s)
| Name | Yasunori TOHJIMA |
|---|---|
| Prefix | Dr. |
| tohjima@nies.go.jp | |
| Organization No | 53 |
| Organization acronym | NIES |
| Organization name | National Institute for Environmental Studies |
| Organization country/territory | Japan |
| Address 1 | |
| Address 2 | National Institute for Environmental Studies |
| Address 3 | 16-2, Onogawa, Tsukuba-shi, Ibaraki 305-8506, Japan |
| Country/territory | Japan |
| Tel | |
| Fax | |
| Last updated date | 2025-07-08 |
| Background observation | |
| UTC+09:00 | |
| ppb | |
|
9999-12-31 00:00:00 - 9999-12-31 23:59:59: NIES96 |
|
|
9999-12-31 00:00:00 - 9999-12-31 23:59:59: Hewlett Packard 5890 II(Gas chromatography (ECD)) |
|
|
9999-12-31 00:00:00 - 9999-12-31 23:59:59: 36.5 (m) |
|
| Unknown | |
|
Primary standard gases are gravimetrically prepared N2O-in-air mixtures. Three working standard gases of different N2O concentration are injected every hour. N2O concentrations of air samples are calculated with calibration curves, which are determined by the data from the two sets of the working standard gases, measured just before and after the set of the air samples. The working standard gases are calibrated against primary standard gases at NIES before and after their use. |
|
| All data obtained during normal operation of the measurement apparatus are reported. | |
|
[Hourly] [Daily] Daily mean concentrations are calculated by averaging the hourly data obtained during the reported day. [Monthly] Monthly mean concentrations are calculated by averaging the daily data obtained during the reported month. |
|
| 9 : The daily mean calculated with lesser than twelve hourly data or the monthly mean calculated with lesser than twenty daily data. | |
|
Valid: 9 |
|
| Temporarily suspended | |
|
The height of the air intake is 36.5 meters above ground level (46.5 meters above mean sea-level). The air samples are dried first by a Nafion® tube dryer and then by a cold trap (-40 °C). The interval between air sample measurements is 10 minutes. Study of long-term trends in the level of atmospheric N2O, as one of the baseline monitoring stations for the global environmental research and the policy-making communities. |
|
|
Wind direction: Wind speed: Relative humidity: Precipitation amount: Air pressure: Air temperature: Dew point temperature: Sea water temperature: Sea surface water temperature: Sea water salinity: Sea surface water salinity: |
|
|
Meteorological data may remain as first provided, even when greenhouse gas data are updated. |
No DOI available
Related information
GAW Data Policy
"For Scientific purposes, access to these data is unlimited and provided without charge.
By their use you accept that an offer of co-authorship will be made through personal contact with the data providers
or owners whenever substantial use is made of their data.
In all cases, an acknowledgement must be made to the data providers or owners and to the data centre when these data are used within a publication."
Citation format
This format is an example of the WDCGG standard citation.
Please follow the citation format which the data providers or owners indicate.
Please follow the citation format which the data providers or owners indicate.
Yasunori TOHJIMA (NIES),
Atmospheric N2O
at Hateruma Island by National Institute for Environmental Studies,
dataset published as N2O_HAT2031_surface-insitu_NIES_data1 at WDCGG,
ver. 2025-01-01-0053 (Reference date*: YYYY/MM/DD)
* As the reference date, please indicate the date you downloaded the files.
* As the reference date, please indicate the date you downloaded the files.
Reference(s)
| 1 | Tohjima Y., Mukai H., Maksyutov S., Takahasji Y., Machida T., Katsumoto M., and Fujinuma Y., 2000 : Variations in atmospheric nitrous oxide observed at Hateruma monitoring station. Chemoshere-Global Change Sci., 2, 435-443. |
|---|


