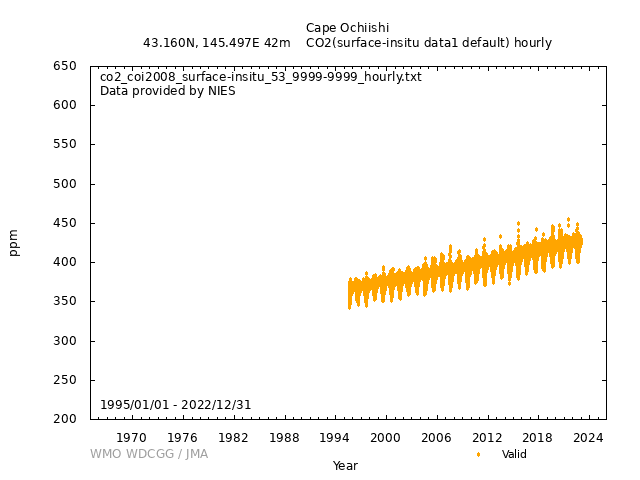
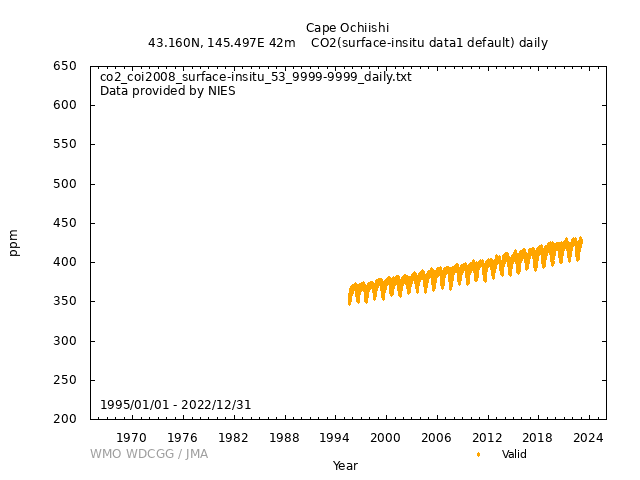
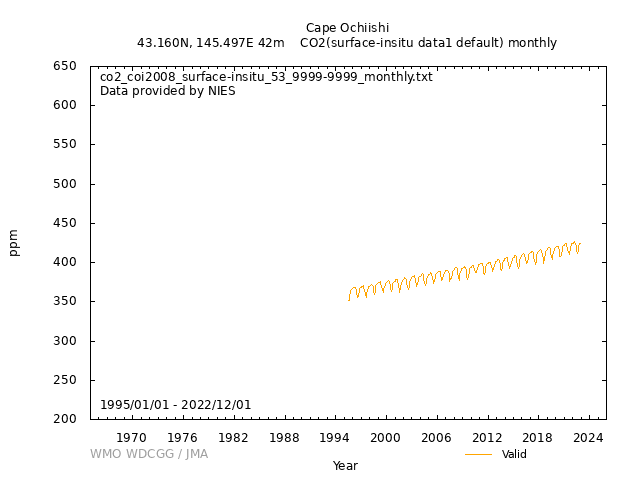
Data Policy
GAW Data Policy
"For Scientific purposes, access to these data is unlimited and provided without charge.
By their use you accept that an offer of co-authorship will be made through personal contact with the data providers
or owners whenever substantial use is made of their data.
In all cases, an acknowledgement must be made to the data providers or owners and to the data centre when these data are used within a publication."
Version
2025-07-17-0128 (Last updated: 2025-07-31)File
This data set is submitted by NIES.
In line with the GAW Data Policy, users should contact the contributors of all data of interest and propose co-authorship or acknowledgement.
Organization
| NO | 53 |
|---|---|
| Acronym | NIES |
| Name | National Institute for Environmental Studies |
| Address 1 | |
| Address 2 | National Institute for Environmental Studies |
| Address 3 | 16-2 Onogawa, Tsukuba 305-8506, Japan |
| Country/Territory | Japan |
| Website | https://www.nies.go.jp/index-e.html |
Contact(s)
| Name | Yukio TERAO |
|---|---|
| Prefix | Dr. |
| yterao@nies.go.jp | |
| Organization No | 53 |
| Organization acronym | NIES |
| Organization name | National Institute for Environmental Studies |
| Organization country/territory | Japan |
| Address 1 | Earth System Division |
| Address 2 | National Institute for Environmental Studies |
| Address 3 | 16-2, Onogawa, Tsukuba-shi, Ibaraki 305-8506, Japan |
| Country/territory | Japan |
| Tel | +81-29-850-2904 |
| Fax | +81-29-858-2645 |
| Last updated date | 2025-07-17 |
| Name | Hitoshi MUKAI |
|---|---|
| Prefix | Dr. |
| lnmukaih@nies.go.jp | |
| Organization No | 53 |
| Organization acronym | NIES |
| Organization name | National Institute for Environmental Studies |
| Organization country/territory | Japan |
| Address 1 | |
| Address 2 | National Institute for Environmental Studies |
| Address 3 | 16-2, Onogawa, Tsukuba-shi, Ibaraki 305-8506, Japan |
| Country/territory | Japan |
| Tel | +81-29-850-2536 |
| Fax | +81-29-858-2645 |
| Last updated date | 2025-07-17 |
| Monitoring background conditions, and the influence of air pollution | |
| UTC | |
| ppm | |
|
9999-12-31 00:00:00 - 9999-12-31 23:59:59: NIES09 |
|
|
9999-12-31 00:00:00 - 9999-12-31 23:59:59: Shimadzu URA207/ Licor-7000(NDIR) |
|
|
9999-12-31 00:00:00 - 9999-12-31 23:59:59: 51.5 (m) |
|
| 5 seconds | |
| Four standard gases are measured for 15 min each, and then sample air is measured for about 2 hours. Since we obtain both standard gases series data before and after the sample air measurement, CO2 concentration for sample air is caluculated from virtual standard measurements at that time estimated from their drifts during 2 hours. | |
| Every 1sec data producd by NDIR is recieived by PC and averaged every 5 sec. One minute data is created from the five second averaged data every minute and stored with the gas selections data (satandards 1, 2, 3, 4 and sample) in the hard drive in PC and the server connected via internet at the site. The PC tempolarly calculate CO2 concentration using standard gas calibration curve created before the sample air measurement. | |
|
[Hourly] Hourly data are taken from the arithmetic mean of observed data for one hour after the irregular and evident error data are rejected. ( i.e; 13:00 data is avereged the date from 13:00 to 13:59) [Daily] Daily mean concentrations are calculated by averaging the hourly data obtained during the reported day. [Monthly] Monthly mean concentrations are calculated by averaging the daily data obtained during the reported month. |
|
|
000: Normal data 1xx: Calibration curve is unstable x1x: Number of data for averaging is less than 30/60 xx1: Data will be recalculated after recalibration |
|
| Operational/Reporting | |
| Stndarad gases are used for over one year. CO2 concentration of these standards are measured again after the usage and stability and drift of the assigned values are checked. Therefore, final CO2 caluculation is obtained after the recalibration of standard gases. | |
|
Wind direction: Wind speed: Relative humidity: Precipitation amount: Air pressure: Air temperature: Dew point temperature: Sea water temperature: Sea surface water temperature: Sea water salinity: Sea surface water salinity: |
|
|
Meteorological data may remain as first provided, even when greenhouse gas data are updated. |
DOI Metadata
| DOI |
|
||||||||||||
|---|---|---|---|---|---|---|---|---|---|---|---|---|---|
| For more information, please refer: doi.org/10.17595/20160901.002 | |||||||||||||
Related information
GAW Data Policy
"For Scientific purposes, access to these data is unlimited and provided without charge.
By their use you accept that an offer of co-authorship will be made through personal contact with the data providers
or owners whenever substantial use is made of their data.
In all cases, an acknowledgement must be made to the data providers or owners and to the data centre when these data are used within a publication."
Citation format
This format is an example of the WDCGG standard citation.
Please follow the citation format which the data providers or owners indicate.
Please follow the citation format which the data providers or owners indicate.
Yukio TERAO (NIES),
Hitoshi MUKAI (NIES),
Atmospheric CO2
at Cape Ochiishi by National Institute for Environmental Studies,
dataset published as CO2_COI2008_surface-insitu_NIES_data1 at WDCGG,
ver. 2025-07-17-0128 (Reference date*: YYYY/MM/DD)
* As the reference date, please indicate the date you downloaded the files.
* As the reference date, please indicate the date you downloaded the files.
Reference(s)
| 1 | Mukai H., Katsumoto M, Ide R., Machida T., Fujinuma Y., Nojiri Y., Inagaki M., Oda N., and Watai T., 2001 : Characterization of atmospheric CO2 observed at two-background air monitoring stations (Hateruma and Ochi-ishi) in Japan. 6th Intern. Carbon Dioxide Conf., Ext.Abstr., Vol 1, 108-111. |
|---|


