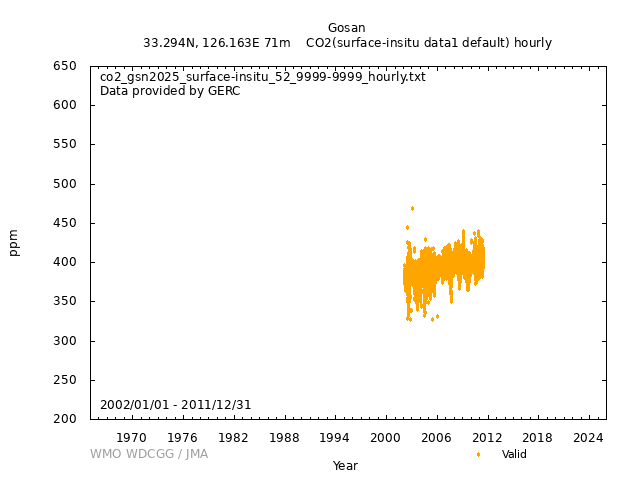
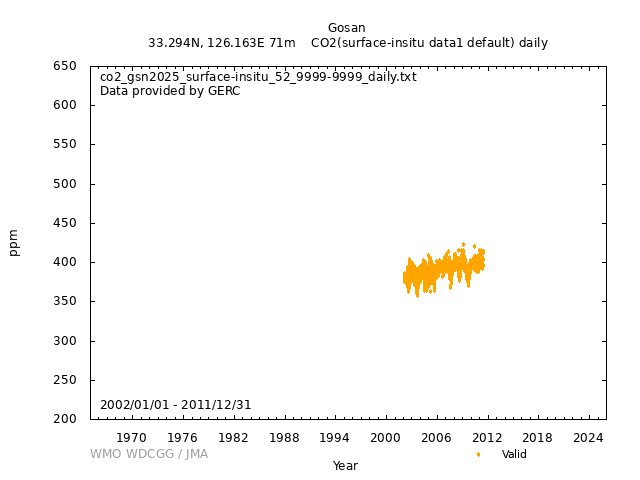
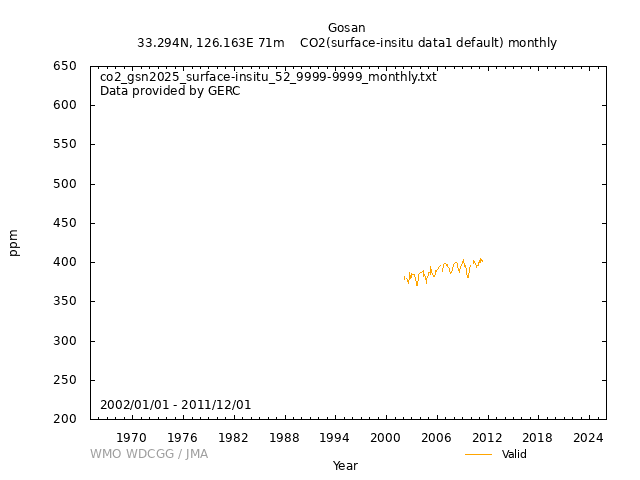
Data Policy
GAW Data Policy
"For Scientific purposes, access to these data is unlimited and provided without charge.
By their use you accept that an offer of co-authorship will be made through personal contact with the data providers
or owners whenever substantial use is made of their data.
In all cases, an acknowledgement must be made to the data providers or owners and to the data centre when these data are used within a publication."
Version
2025-12-03-1352 (Last updated: 2025-12-04)File
This data set is submitted by GERC.
In line with the GAW Data Policy, users should contact the contributors of all data of interest and propose co-authorship or acknowledgement.
Organization
| NO | 52 |
|---|---|
| Acronym | GERC |
| Name | National Institute of Environmental Research |
| Address 1 | The National Institute of Environmental Research |
| Address 2 | Environmental Research Complex |
| Address 3 | Hwangyeong-ro 42, Seo-gu, Incheon, 22689 |
| Country/Territory | Republic of Korea |
| Website | http://eng.me.go.kr/eng/web/index.do?menuId=46 |
Contact(s)
| Name | Jiyoung Kim |
|---|---|
| Prefix | Ms. |
| jykim77@korea.kr | |
| Organization No | 52 |
| Organization acronym | GERC |
| Organization name | National Institute of Environmental Research |
| Organization country/territory | Republic of Korea |
| Address 1 | |
| Address 2 | Environmental Research Complex |
| Address 3 | Hwangyeong-ro 42, Seo-gu, Incheon, 22689 |
| Country/territory | Republic of Korea |
| Tel | +82-32-560-7309 |
| Fax | +82-32-568-2042 |
| Last updated date | 2020-07-28 |
| Name | Eunjung Kim |
|---|---|
| Prefix | Ms. |
| 2929eun@korea.kr | |
| Organization No | 52 |
| Organization acronym | GERC |
| Organization name | National Institute of Environmental Research |
| Organization country/territory | Republic of Korea |
| Address 1 | |
| Address 2 | Environmental Research Complex |
| Address 3 | Hwangyeong-ro 42, Seo-gu, Incheon, 22689 |
| Country/territory | Republic of Korea |
| Tel | +82-32-560-7410 |
| Fax | +82-32-568-2042 |
| Last updated date | 2020-07-28 |
|
|||||||
| Background observation | |||||||
| UTC+09:00 | |||||||
| ppm | |||||||
|
9999-12-31 00:00:00 - 9999-12-31 23:59:59: WMO CO2 X2007 |
|||||||
|
9999-12-31 00:00:00 - 9999-12-31 23:59:59: Ultramat 6, Siemens Range : 0- 500 ppmv Chopper frequency : 13.098 Hz Chopper Temperature : 164.8 Celsius Detecter Temperature : 43.7 Celsius Pressure range : 10 hpa Barometric pressure : 1005 hpa Analog output : 4~20 mA Zero drift : < ±1% of measuring span per week Sample point drift : < ±1% of the point per week Sample gas flow : 1 L/min (NDIR) |
|||||||
|
9999-12-31 00:00:00 - 9999-12-31 23:59:59: 10 (m) |
|||||||
| 30 seconds | |||||||
|
1. All data with obvious sampling or instrument operation problems are rejected. 2. The hourly data divide into two groups, background and pollution, by a statistical method. 3. To eliminate local effect, the hourly data in the following wind sectors are rejected. WD=67.5° with wind speed < 22 m/s WD=22.5, 45, 90, 112.5° with wind speed < 11 m/s wind speed < 3 m/s 4. The daily data with the number of hourly data less than 7 are rejected. 5. Daily data are calculated from selected hourly data. 6. Monthly data are calculated using the daily data. |
|||||||
|
[Hourly] 1. All data with obvious sampling or instrument operation problems are rejected. 2. The hourly data divide into two groups, background and pollution, by a statistical method. 3. To eliminate local effect at a pollution group, the hourly data in the following wind sectors are rejected. WD=67.5° with wind speed < 22 m/s WD=22.5, 45, 90, 112.5° with wind speed < 11 m/s wind speed < 3 m/s 4. The daily data with the number of hourly data less than 7 are rejected. [Daily] Daily data are calculated from selected hourly data. [Monthly] Monthly data are calculated using the daily data. |
|||||||
| Temporarily suspended | |||||||
| To track the progress of 'Global Greenhouse Effect' on the Korean peninsula with investigating the concentration of greenhouse gases and their variations. | |||||||
|
Wind direction: Wind speed: Relative humidity: Precipitation amount: Air pressure: Air temperature: Dew point temperature: Sea water temperature: Sea surface water temperature: Sea water salinity: Sea surface water salinity: |
|||||||
|
Meteorological data may remain as first provided, even when greenhouse gas data are updated. |
No DOI available
Related information
GAW Data Policy
"For Scientific purposes, access to these data is unlimited and provided without charge.
By their use you accept that an offer of co-authorship will be made through personal contact with the data providers
or owners whenever substantial use is made of their data.
In all cases, an acknowledgement must be made to the data providers or owners and to the data centre when these data are used within a publication."
Citation format
This format is an example of the WDCGG standard citation.
Please follow the citation format which the data providers or owners indicate.
Please follow the citation format which the data providers or owners indicate.
Jiyoung Kim (GERC),
Eunjung Kim (GERC),
Atmospheric CO2
at Jeju Gosan by National Institute of Environmental Research,
dataset published as CO2_GSN2025_surface-insitu_GERC_data1 at WDCGG,
ver. 2025-12-03-1352 (Reference date*: YYYY/MM/DD)
* As the reference date, please indicate the date you downloaded the files.
* As the reference date, please indicate the date you downloaded the files.


