Data Policy
GAW Data Policy
"For Scientific purposes, access to these data is unlimited and provided without charge.
By their use you accept that an offer of co-authorship will be made through personal contact with the data providers
or owners whenever substantial use is made of their data.
In all cases, an acknowledgement must be made to the data providers or owners and to the data centre when these data are used within a publication."
Version
2025-01-01-0045 (Last updated: 2024-12-24)File
This data set is submitted by LSCE.
In line with the GAW Data Policy, users should contact the contributors of all data of interest and propose co-authorship or acknowledgement.
Organization
| NO | 45 |
|---|---|
| Acronym | LSCE |
| Name | Laboratoire des Sciences du Climat et de l'Environnement |
| Address 1 | LSCE |
| Address 2 | CEA-Orme des Merisiers, F-91191 GIF-SUR-YVETTE |
| Address 3 | |
| Country/Territory | France |
| Website | http://www.lsce.ipsl.fr/ |
Contact(s)
| Name | Michel Ramonet |
|---|---|
| Prefix | Dr. |
| michel.ramonet@lsce.ipsl.fr | |
| Organization No | 45 |
| Organization acronym | LSCE |
| Organization name | Laboratoire des Sciences du Climat et de l'Environnement |
| Organization country/territory | France |
| Address 1 | |
| Address 2 | |
| Address 3 | LSCE - CEA Saclay - Orme des Merisiers - 91191 Gif-sur-Yvette, France |
| Country/territory | France |
| Tel | +33 (0)1 69 08 40 14 |
| Fax | +33 (0)1 69 08 77 16 |
| Last updated date | 2025-10-20 |
| Background observation | |
| UTC | |
| ppm | |
|
9999-12-31 00:00:00 - 2005-12-31 23:59:59: WMO CO2 X1993 2006-01-01 00:00:00 - 9999-12-31 23:59:59: WMO CO2 X2002 |
|
|
9999-12-31 00:00:00 - 2005-12-31 23:59:59: Siemens Ultramat5F(NDIR) 2006-01-01 00:00:00 - 9999-12-31 23:59:59: LoFlo2C(NDIR) |
|
| Unknown | |
|
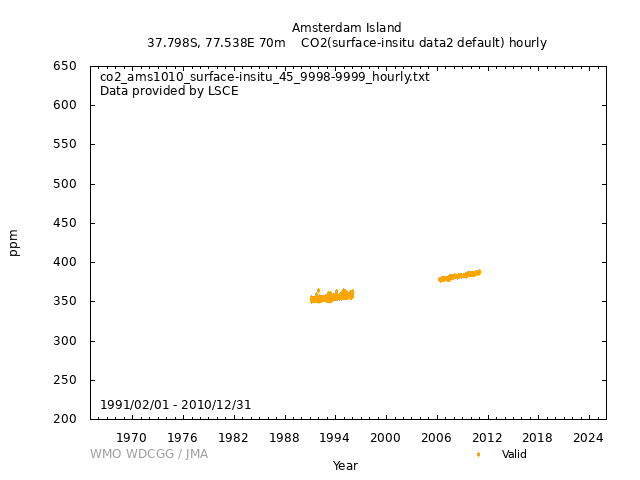
Each two hours, the in-situ CO2 record is calibrated against four working standard gases. These gases are calibrated every two months against a set of 6 standard gases, which are themselves verified every year against the primary scale. Eight WMO X93 scale standard gases (calibrated at SIO) are used as primary scale. From 2006, we use a LoFlo instrument that is calibrated once per month against 7 standards calibrated by NOAA in 2002 (WMO x2002 scale). |
|
|
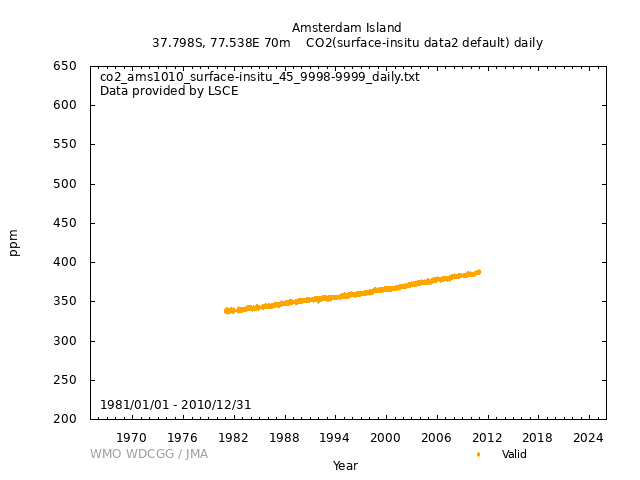
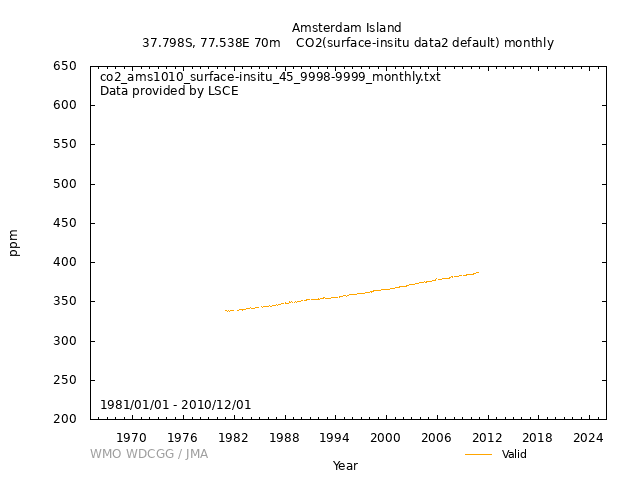
[Hourly] (1) Rejection of the periods of analytical problems (2) Selection of the hourly mean values in the following wind sectors : 300° <= WD <= 360° with wind speed >= 5 m/s 0° <= WD <= 50° with wind speed >= 5 m/s 260° < WD < 300° with wind speed > 8 m/s (3) Selection of the periods which include at least 4 consecutive hours in the above sectors [Daily] Take the arithmetic mean of selected hourly data. [Monthly] Take the arithmetic mean of daily data. |
|
| Temporarily suspended | |
|
Air is pumped through a WISA II pump at a flow rate of 200 cc min-1 through Dekabon line (Ø=12mm). Air is dried using an ethanol cryogenic trap at -60°C. From 2006 we use a LoFlo NDIR instrument. Air is pumped through a Dekabon Line (Ø=12mm) with a KNF N86 KT pump at about 2 L/min. Air is dried with a Nafion membrane combined to perchlorate magnesium. The geographical situation of the station offers the opportunity to monitor background concentrations in southern mid-latitudes. The scientific aim is to improve our knowledge of the oceanic carbon sink in this area, as well as the emissions from South Africa. Amsterdam Island belongs to an important sampling strategy with the presence of New Caledonia (LSCE & IRD, France), Cape Grim (LSCE & CSIRO, Australia) and Cape Point (SAWB, South Africa) in the same latitude and with a regular sea transect over South Indian Ocean with the french oceanographic ship "Marion Dufresne". |
|
|
Wind direction: 1 Wind speed: 1 Relative humidity: 1 Precipitation amount: 0 Air pressure: 0 Air temperature: 1 Dew point temperature: 0 Sea water temperature: 0 Sea surface water temperature: 0 Sea water salinity: 0 Sea surface water salinity: 0 |
|
|
Meteorological data may remain as first provided, even when greenhouse gas data are updated. The file was made using the former WDCGG data file. |
No DOI available
Related information
GAW Data Policy
"For Scientific purposes, access to these data is unlimited and provided without charge.
By their use you accept that an offer of co-authorship will be made through personal contact with the data providers
or owners whenever substantial use is made of their data.
In all cases, an acknowledgement must be made to the data providers or owners and to the data centre when these data are used within a publication."
Citation format
This format is an example of the WDCGG standard citation.
Please follow the citation format which the data providers or owners indicate.
Please follow the citation format which the data providers or owners indicate.
Michel Ramonet (LSCE),
Atmospheric CO2
at Amsterdam Island by Laboratoire des Sciences du Climat et de l'Environnement,
dataset published as CO2_AMS1010_surface-insitu_LSCE_data2 at WDCGG,
ver. 2025-01-01-0045 (Reference date*: YYYY/MM/DD)
* As the reference date, please indicate the date you downloaded the files.
* As the reference date, please indicate the date you downloaded the files.
Reference(s)
| 1 | Gaudry A., P. Monfray, G. Polian and G. Lambert, 1987: The 1982-1983 El-Nino: a 6 Billion Ton CO2 release. Tellus, 39B, 209-213. |
|---|---|
| 2 | Gaudry A., J. M. Ascencio-Parvy, and G. Lambert, 1983: Preliminary Study of CO2 Variations at Amsterdam Island (Territoire des Terres Australes et Antarctiques Fran¹Êses). J. Geophys. Res., 88, 1323-1329. |
| 3 | Ascencio-Parvy J. M., A. Gaudry and G. Lambert, 1984: Year-toyear CO2 variations at Amsterdam Island in 1980-1983. Geoph. Res. Lett., 11, 1215-1217. |
| 4 | Monfray P., A. Gaudry, G. Polian and G. Lambert, 1987: Seasonal variations of atmospheric CO2 in the Southern Indian Ocean. Tellus, 39B, 67-71. |
| 5 | Gaudry A., P. Monfray, G. Polian, G. Bonsang, B. Ardouin, A. Jegou, and G. Lambert, 1990: Non-seasonal variations of atmospheric CO2 concentrations at Amsterdam Island. Tellus, 43B, 136-143. |


