Data Policy
GAW Data Policy
"For Scientific purposes, access to these data is unlimited and provided without charge.
By their use you accept that an offer of co-authorship will be made through personal contact with the data providers
or owners whenever substantial use is made of their data.
In all cases, an acknowledgement must be made to the data providers or owners and to the data centre when these data are used within a publication."
Version
2025-01-01-0041 (Last updated: 2024-12-24)File
This data set is submitted by KSNU.
In line with the GAW Data Policy, users should contact the contributors of all data of interest and propose co-authorship or acknowledgement.
Organization
| NO | 41 |
|---|---|
| Acronym | KSNU |
| Name | Kyrgyz National University |
| Address 1 | |
| Address 2 | |
| Address 3 | 720033, Biskek, Frunze street 547 |
| Country/Territory | Kyrgyzstan |
| Website | http://www.university.kg/ |
Contact(s)
| Name | V. Sinyakov |
|---|---|
| Prefix | Dr. |
| sinvalery@yandex.ru | |
| Organization No | 41 |
| Organization acronym | KSNU |
| Organization name | Kyrgyz National University |
| Organization country/territory | Kyrgyzstan |
| Address 1 | |
| Address 2 | |
| Address 3 | Manas Street 101, Bishkek, 720033, Kyrgyz Republic |
| Country/territory | Kyrgyzstan |
| Tel | |
| Fax | +996-312-282859 |
| Last updated date | 2018-06-01 |
|
|||||||
| Background observation | |||||||
| UTC+05:00 | |||||||
| ppm | |||||||
|
9999-12-31 00:00:00 - 9999-12-31 23:59:59: Infrared Spectrophotometer based on MDR-41 monochromator manufactured by LOMO, St-Petersburg, Russia(Light absorption analysis (IR, except NDIR) ) |
|||||||
| Unknown | |||||||
| The control sampled air was collected on surface of the earth and different heights with aircraft simultaneously with measurement of CO2 with spectrophotometer method. Concentration of CO2 into sampled air had been determined with NDIR/URAS in MGO (Russia ). calibration scale : Observer's standard | |||||||
| The data acquisition system provides three minutes mean raw data. Invalid data caused by local impact, malfunction or other effects were recognised by comparison/correlation with other trace substances and meteorological data or with information from the station logbook and were rejected. | |||||||
|
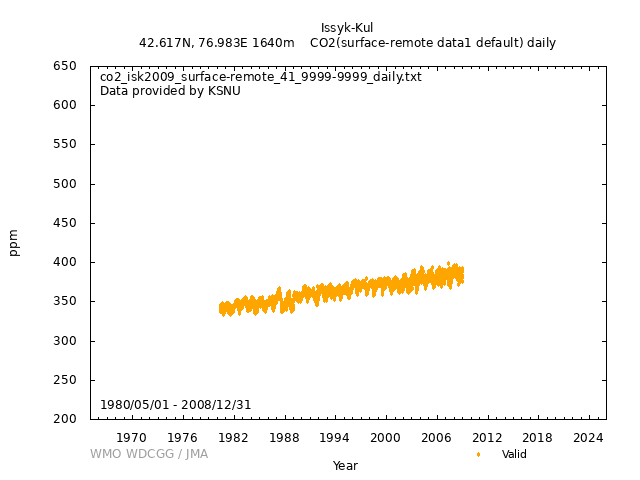
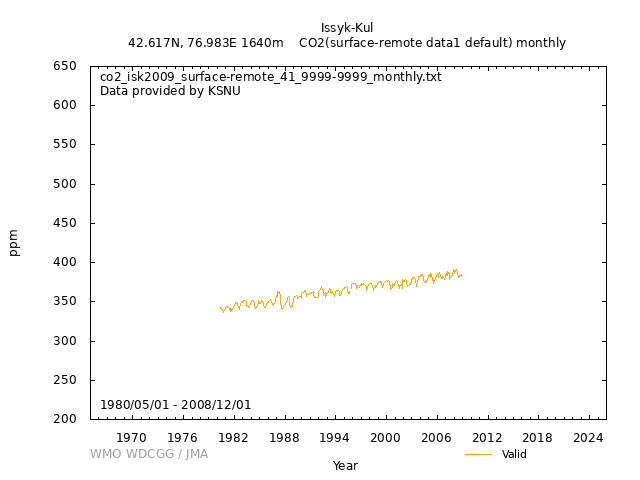
[Hourly] [Daily] Arithmetic means are calculated from valid hourly data. [Monthly] Arithmetic means are calculated from valid daily data. |
|||||||
| The three-digit validation code recommended by WDCGG in "Data reporting manual of the WMO World Data Centre for Greenhouse gases (WDCGG)", # 1, January 1991 (Table 6, p. 34) uses as the data flag | |||||||
| Temporarily suspended | |||||||
|
Sampling and Analysis Frequency : continuously during the day depending on sky conditions The spectroscopic method for measurements of carbon dioxide content in the atmospheric depth is based on recording spectra of the solar radiation that passed through the atmosphere within the CO2 absorption band 4n2 + n3 with the centre near 2.06 m with the resolution of 3 cm-1. To measure CO2 content with the spectrogram obtained an experimental value of the transmission function Q is calculated. The function Q is present as a ratio of signal average intensities sum within the range of 4788.9 - 4807.4 and 4886.9 - 4906.0 cm-1 corresponding to the wings of the band of 2.06 m , to the signal doubled average intensity within the range of 4807.4 - 4886.9 cm-1 at the center of this band. Carbon dioxide content in the atmosphere is determined at a comparison of an experimentally obtained transmission function Q with the calculated calibrated dependence of the function on total CO2 content in the atmospheric column. The calculation of the calibration dependence for the function Q is made by the line-by-line method with the spectroscopic parameters of CO2 and water vapor absorption lines from the up-to-day parameter compilations, the results of laboratory measurements validating the above parameters and statistical monthly mean vertical profiles of pressure, temperature and relative humidity of the atmosphere in the spectroscopic observation site. The results of spectroscopic measurements of total CO2 content in the atmospheric column can be presented as height-averaged relative volumetric concentrations of CO2 considered uniformly mixed in the atmosphere. The spectroscopic measurements are performed with the spectrometric instrumentation set. The errors of single spectroscopic measurements of height averaged CO2 concentration in the atmosphere are equal to ± 3 ppm (± 1 %). For CO2 spectroscopic measurements with the Sun as a radiation source are most efficient in the continental conditions because the measurement results are almost unaffected by random ground sources of CO2 . This is their difference from measurements of CO2 concentrations in the samples of ground surface air with the help of optical acoustical gas analysers made at the stations of the global network for background monitoring of the atmosphere. measurement range: CO2 absorption band 4n2+n3 (4788.9 - 4906.0 cm-1) with the center near 2.06 micrometer spectral resolution: 3 cm-1 Scientific Aim : Monitoring of long-term evolution of the atmospheric CO2 in rural of continental region and study of local and regional phenomena. |
|||||||
|
Wind direction: Wind speed: Relative humidity: Precipitation amount: Air pressure: Air temperature: Dew point temperature: Sea water temperature: Sea surface water temperature: Sea water salinity: Sea surface water salinity: |
|||||||
|
Meteorological data may remain as first provided, even when greenhouse gas data are updated. |
No DOI available
Related information
GAW Data Policy
"For Scientific purposes, access to these data is unlimited and provided without charge.
By their use you accept that an offer of co-authorship will be made through personal contact with the data providers
or owners whenever substantial use is made of their data.
In all cases, an acknowledgement must be made to the data providers or owners and to the data centre when these data are used within a publication."
Citation format
This format is an example of the WDCGG standard citation.
Please follow the citation format which the data providers or owners indicate.
Please follow the citation format which the data providers or owners indicate.
V. Sinyakov (KSNU),
Atmospheric CO2
at Issyk-Kul by Kyrgyz National University,
dataset published as CO2_ISK2009_surface-remote_KSNU_data1 at WDCGG,
ver. 2025-01-01-0041 (Reference date*: YYYY/MM/DD)
* As the reference date, please indicate the date you downloaded the files.
* As the reference date, please indicate the date you downloaded the files.
Reference(s)
| 1 | Aref'ev, V.N., Kamenogradsky, N.E. and Kashin, F.V., 1990: Systematic measurement of atmospheric carbon dioxide concentration, Atmospheric and Oceanic Physics, No. 6, vol. 26, 584-593. |
|---|---|
| 2 | Aref'ev, V.N., Kamenogradsky, N.E. and Kashin, F.V., 1995: Carbon dioxide in continent atmosphere, Meteorology and Hydrology, No. 4, 87-96. |


