Data Policy
GAW Data Policy
"For Scientific purposes, access to these data is unlimited and provided without charge.
By their use you accept that an offer of co-authorship will be made through personal contact with the data providers
or owners whenever substantial use is made of their data.
In all cases, an acknowledgement must be made to the data providers or owners and to the data centre when these data are used within a publication."
Version
2025-05-12-1116 (Last updated: 2025-05-15)File
This data set is submitted by KMD.
In line with the GAW Data Policy, users should contact the contributors of all data of interest and propose co-authorship or acknowledgement.
Organization
| NO | 40 |
|---|---|
| Acronym | KMD |
| Name | Kenya Meteorological Department |
| Address 1 | Kenyan Meteorological Department Kenya Meteorological Department |
| Address 2 | KMD |
| Address 3 | Dagoretti Corner P.O. Box 30259 00100 Nairobi |
| Country/Territory | Kenya |
| Website |
Contact(s)
| Name | Martin Steinbacher |
|---|---|
| Prefix | Dr. |
| martin.steinbacher@empa.ch | |
| Organization No | 23 |
| Organization acronym | Empa |
| Organization name | Swiss Federal Laboratories for Materials Science and Technology |
| Organization country/territory | Switzerland |
| Address 1 | Ueberlandstrasse 129 |
| Address 2 | CH-8600 Duebendorf |
| Address 3 | Switzerland |
| Country/territory | Switzerland |
| Tel | +41 58 765 4048 |
| Fax | |
| Last updated date | 2025-10-02 |
| Name | Jörg Klausen |
|---|---|
| Prefix | Dr. |
| joerg.klausen@meteoswiss.ch | |
| Organization No | 127 |
| Organization acronym | MeteoSwiss |
| Organization name | Federal Office of Meteorology and Climatology MeteoSwiss |
| Organization country/territory | Switzerland |
| Address 1 | |
| Address 2 | |
| Address 3 | 8058 ZH,Zürich-Flughafen Operation Center 1, Switzerland |
| Country/territory | Switzerland |
| Tel | +41 58 460 92 23 |
| Fax | |
| Last updated date | 2025-05-12 |
| Name | Christoph Zellweger |
|---|---|
| Prefix | |
| christoph.zellweger@empa.ch | |
| Organization No | 23 |
| Organization acronym | Empa |
| Organization name | Swiss Federal Laboratories for Materials Science and Technology |
| Organization country/territory | Switzerland |
| Address 1 | Ueberlandstrasse 129 |
| Address 2 | CH-8600 Duebendorf |
| Address 3 | |
| Country/territory | Switzerland |
| Tel | +41 58 765 4328 |
| Fax | +41 58 765 1122 |
| Last updated date | 2025-05-12 |
| Name | David Murithi Njiru |
|---|---|
| Prefix | |
| njimdv@gmail.com | |
| Organization No | 40 |
| Organization acronym | KMD |
| Organization name | Kenya Meteorological Department |
| Organization country/territory | Kenya |
| Address 1 | Kenya Meteorological Department MT KENYA GAW STATION |
| Address 2 | P.O. Box 192 10400 NANYUKI Kenya |
| Address 3 | |
| Country/territory | Kenya |
| Tel | +254 721 218 207 |
| Fax | |
| Last updated date | 2025-05-12 |
| Name | Mathew Mutuku |
|---|---|
| Prefix | |
| mathewmutuku38@gmail.com | |
| Organization No | 40 |
| Organization acronym | KMD |
| Organization name | Kenya Meteorological Department |
| Organization country/territory | Kenya |
| Address 1 | |
| Address 2 | |
| Address 3 | |
| Country/territory | Kenya |
| Tel | |
| Fax | |
| Last updated date | 2025-05-12 |
|
|||||||||||||
| Background observation | |||||||||||||
| UTC | |||||||||||||
| ppb | |||||||||||||
|
9999-12-31 00:00:00 - 2006-12-31 23:59:59: WMO CO X2000 2019-12-14 23:59:59 - 9999-12-31 23:59:59: WMO CO X2014A |
|||||||||||||
|
2002-05-31 00:00:00 - 2006-05-31 23:59:59: TEI 48C TL (SN: 66838-352)(NDIR) 2019-12-14 23:59:59 - 9999-12-31 23:59:59: Picarro, Inc., G2401 (SN: CFKADS2320)(CRDS) |
|||||||||||||
|
2002-05-31 00:00:00 - 2006-05-31 23:59:59: 4.5 (m) 2019-12-14 23:59:59 - 9999-12-31 23:59:59: 10 (m) |
|||||||||||||
| 5 seconds | |||||||||||||
|
For the NDIR instrument (2002 to 2006): Automatic zero and span calibration are performed every 2 hours (20 minutes zero, 10 minutes span). Zero air is generated using a custom built system consisting of a rubin gel cartridge, a SOFNOCAT 423 (Molecular Products Ltd) cartridge, inlet and outlet filters. The span gas concentration is created using a higher concentration laboratory standard (traced back to WMO-2000 CO scale by GAW World Calibration Center (WCC), Empa), which is diluted with zero air (using Bronckhorst mass flow controllers) and fed into the span gas inlet. In addition, manual span gas checks directly using 1 ppm laboratory standards (WMO-2000) are performed by the station operators once per month. For the CRDS instrument (2020 and onwards): measurements are calibrated about once a week with three reference gases, purchased from the GAW Central Calibration Laboratory at NOAA, and a forth reference gas, determined by the World Calibration Centre at Empa. A fifth reference tank is measured about three times per week for quality control, i.e. as target tank which is treated as unknown in the same way as the ambient air data. |
|||||||||||||
|
for the NDIR measurements (2002 to 2006): Due to the CO zero drift, zero conditions during ambient air sampling are interpolated from zero air measurements using local regression models. A span correction is applied in a similar way. The combined uncertainty of every individual 1-min CO measurement is then determined from the contributions of the uncertainty of the CO analyzer, the uncertainty of the zero correction and the uncertainty of the span correction. for the CRDS measurements (2020 and onwards): Observations are performed with a commercially available instrument (Picarro Inc. G2401) based on the Wavelength-Scanned Cavity Ringdown Spectroscopy technique coupled to a custom-built calibration unit. Sample was dried prior to analysis by means of a Nafion dryer. For the determination of dry air mole fractions, interference of the remaining water was eliminated by applying an experimentally determined correction. value_unc gives the standard deviation of the hourly means (based on 1-min data), of the daily means (based on hourly data), and monthly means (based on daily data), in accordance with the WDCGG data submission manual. Quality assurance procedures involve time series plots, target tank (i.e. cylinders containing natural air with assigned trace gas mole fractions that are treated as (unknown) sample in a sequence of analyses) measurements, and consistency checks. |
|||||||||||||
|
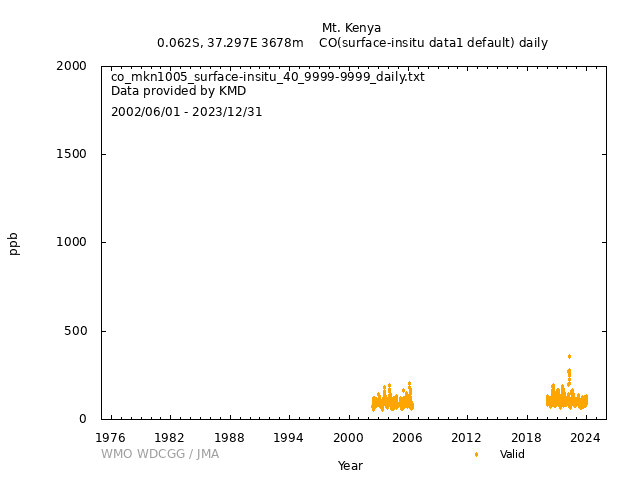
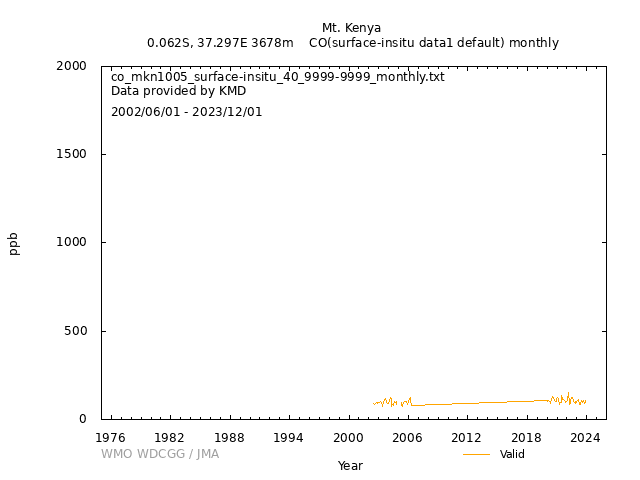
[Hourly] 2002 to 2006: All aggregate calculations based on 1-minute aggregates, 40% availability required for aggregate. Uncertainty of aggregate following ISO 11222. 2020 and onwards: high-resolution data are aggregated to 1min averages before hourly averages are calculated. Thus, nvalue (the number of observations) refers to the number of available 1min averages within the respective hour. A minimum of 20 1-min averages needs to be available to calculate hourly averages; otherwise, hourly data are reported as not available. [Daily] 2020 and onwards: hourly averages are aggregated to daily means. Thus, nvalue (the number of observations) refers to the number of available hourly averages within the respective day. A minimum of 8 hourly averages needs to be available to calculate daily averages; otherwise, daily data are reported as not available. [Monthly] 2020 and onwards: daily data are aggregated to monthly means. Thus, nvalue (the number of observations) refers to the number of available daily averages within the respective month. A minimum of 10 daily averages needs to be available to calculate monthly averages; otherwise, monthly data are reported as not available. |
|||||||||||||
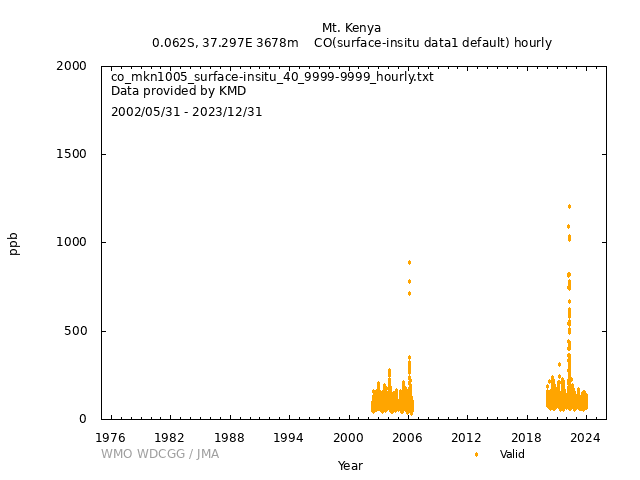
| Only valid measurements are reported. No additional flag is provided. Regional pollution events are not filtered. Occasionally, bush fires in the vicinity lead to high particle and trace gas concentrations, in particular for carbon monoxide (like in early 2006 and early 2022). This data is still part of the data files. | |||||||||||||
|
Valid: 2 Invalid: 3 |
|||||||||||||
| Operational/Reporting | |||||||||||||
|
The MKN station is situated on the north-western slope of Mt. Kenya at an altitude of 3680 m a.s.l. and is surrounded by alpine grassland and brushes. As part of the Mt.Kenya National Park the whole mountain area is protected and there are no local anthropogenic emissions, making the site suitable for continuous observations of the background free tropospheric composition. The closest human settlement with rather low emission sources is situated 17 km in north-westerly direction. Occasionally, bush fires in the vicinity lead to high particle and trace gas concentrations, in particular for carbon monoxide (like in early 2006 and early 2022). This data is still part of the data files. for the NDIR measurements (2002 to 2006): A rain and snow protected air inlet system is mounted 4.5 m above ground and is connected to a glass manifold (length 3 m, diameter 5 cm) to which individual instruments are connected. The manifold is permanently flushed by a high volume pump. Residence times were estimated to be below 10 s. Sample air is taken from the glass manifold through a 1.5 m, 4 mm diameter teflon tubing at a flow rate of 1 lpm. A 47 mm teflon filter (5-6 micron) is installed before the sample gas inlet and is regularly exchanged. To reduce the interference with water vapor, a Nafion dryer (PERMAPURE PD-50-24'') is installed in the sampling line, operating in reflux mode using a critical orifice. for the CRDS measurements (2020 and onwards): Inlet at 10 m above ground; tubing material: Dekabon/Synflex 1/4" OD; total inlet length approx. 12m; flow rate into lab: 5 lpm; sample is dried with a Nafion dryer. |
|||||||||||||
|
Wind direction: 1 Wind speed: 1 Relative humidity: 1 Precipitation amount: 1 Air pressure: 1 Air temperature: 1 Dew point temperature: 0 Sea water temperature: 0 Sea surface water temperature: 0 Sea water salinity: 0 Sea surface water salinity: 0 |
|||||||||||||
|
Meteorological data may remain as first provided, even when greenhouse gas data are updated. Meteorological measurements are jointly operated by KMD and MeteoSwiss. |
DOI Metadata
| DOI |
|
||||||||||||||||
|---|---|---|---|---|---|---|---|---|---|---|---|---|---|---|---|---|---|
| Version |
2025-05-12-1116 (Data Version History) * DOIs and file names may have multiple versions. Be sure to check the data version. |
||||||||||||||||
| Title | Atmospheric CO at Mt. Kenya by Kenya Meteorological Department, dataset published as CO_MKN1005_surface-insitu_KMD_data1 at WDCGG | ||||||||||||||||
| Creator |
Kenya Meteorological Department Martin Steinbacher (Empa) Jörg Klausen (Empa) Christoph Zellweger (Empa) David Murithi Njiru (Empa) Mathew Mutuku (Empa) |
||||||||||||||||
| Publisher | World Data Centre for Greenhouse Gases | ||||||||||||||||
| Publication Date | 2018-06-19 (Last Updated: 2025-05-15) | ||||||||||||||||
| Format | Text (WDCGG Data Format Table, WDCGG Meteorological Data Format Table), NetCDF | ||||||||||||||||
| Relation List (Is Part Of) |
All CO data contributed to WDCGG by GAW stations and mobiles by 2025-09-17 All CO data contributed to WDCGG by GAW stations and mobiles by 2024-09-24 All CO data contributed to WDCGG by GAW stations and mobiles by 2023-09-13 All CO data contributed to WDCGG by GAW stations and mobiles by 2022-09-05 All CO data contributed to WDCGG by GAW stations and mobiles by 2021-08-27 All CO data contributed to WDCGG by GAW stations and mobiles by 2020-09-28 All CO data contributed to WDCGG by GAW stations and mobiles by 2019-09-19 All CO data contributed to WDCGG by GAW stations and mobiles by 2018-10-25 |
||||||||||||||||
| Geolocation Point |
|
GAW Data Policy
"For Scientific purposes, access to these data is unlimited and provided without charge.
By their use you accept that an offer of co-authorship will be made through personal contact with the data providers
or owners whenever substantial use is made of their data.
In all cases, an acknowledgement must be made to the data providers or owners and to the data centre when these data are used within a publication."
Citation format
This format is an example of the WDCGG standard citation.
Please follow the citation format which the data providers or owners indicate.
Please follow the citation format which the data providers or owners indicate.
Martin Steinbacher (Empa),
Jörg Klausen (MeteoSwiss),
Christoph Zellweger (Empa),
David Murithi Njiru (KMD),
Mathew Mutuku (KMD),
Atmospheric CO
at Mt. Kenya by Kenya Meteorological Department,
dataset published as CO_MKN1005_surface-insitu_KMD_data1 at WDCGG,
ver. 2025-05-12-1116, https://doi.org/10.50849/WDCGG_0040-1005-3001-01-01-9999 (Reference date*: YYYY/MM/DD)
* As the reference date, please indicate the date you downloaded the files.
* As the reference date, please indicate the date you downloaded the files.
Reference(s)
| 1 | Henne, S., Junkermann, W., Kariuki, J. M., Aseyo, J., & Klausen, J. (2008). Mount Kenya Global Atmosphere Watch Station (MKN): Installation and Meteorological Characterization, Journal of Applied Meteorology and Climatology, 47(11), 2946-2962. DOI: 10.1175/2008JAMC1834.1 |
|---|---|
| 2 | Henne, S., Klausen, J., Junkermann, W., Kariuki, J. M., Aseyo, J. O., and Buchmann, B.: Representativeness and climatology of carbon monoxide and ozone at the global GAW station Mt. Kenya in equatorial Africa, Atmos. Chem. Phys., 8, 3119–3139, https://doi.org/10.5194/acp-8-3119-2008, 2008. |
| 3 | Kirago L., Ö. Gustafsson, S. M. Gaita, S. L. Haslett, M. J. Gatari, M. E. Popa, T. Röckmann, C. Zellweger, M. Steinbacher, J. Klausen, C. Felix, D. Njiru, A. Andersson, 2023, Sources and long-term variability of carbon monoxide at Mount Kenya and in Nairobi, Atmospheric Chemistry and Physics, 23, 14349–14357, https://doi.org/10.5194/acp-23-14349-2023. |


