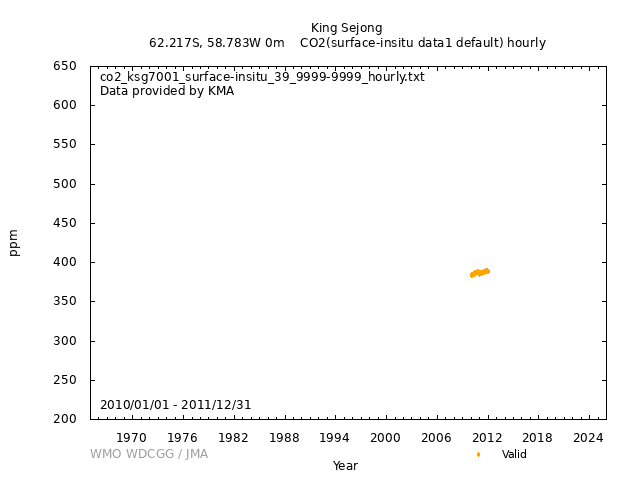
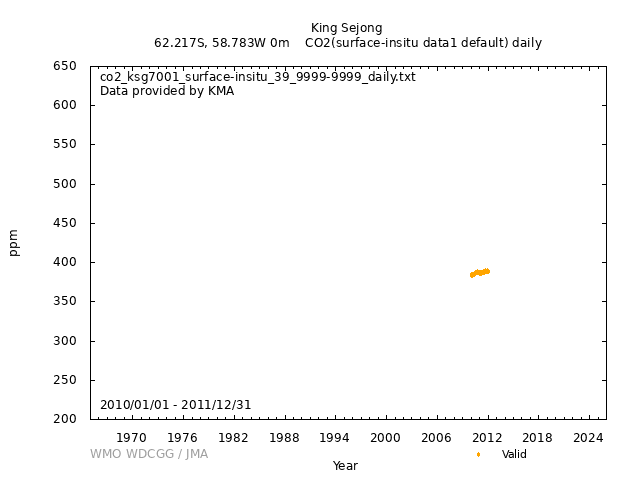
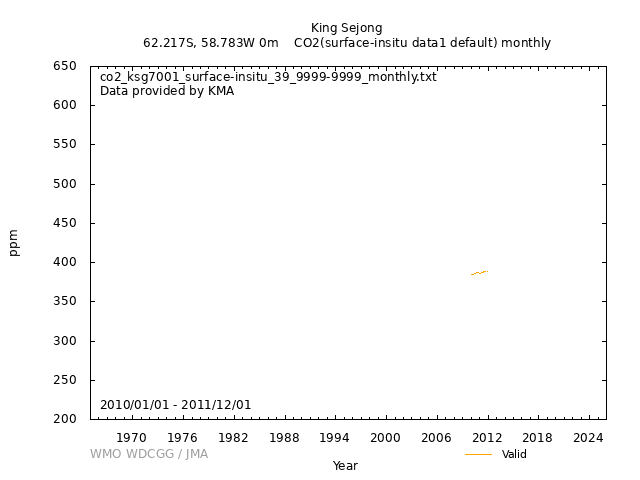
Data Policy
GAW Data Policy
"For Scientific purposes, access to these data is unlimited and provided without charge.
By their use you accept that an offer of co-authorship will be made through personal contact with the data providers
or owners whenever substantial use is made of their data.
In all cases, an acknowledgement must be made to the data providers or owners and to the data centre when these data are used within a publication."
Version
2025-08-01-0951 (Last updated: 2025-08-01)File
This data set is submitted by KMA.
In line with the GAW Data Policy, users should contact the contributors of all data of interest and propose co-authorship or acknowledgement.
Organization
| NO | 39 |
|---|---|
| Acronym | KMA |
| Name | Korea Meteorological Administration |
| Address 1 | |
| Address 2 | KMA/NIMS |
| Address 3 | 33, Seohobuk-ro, Seogwipo, Jeju, 63568 |
| Country/Territory | Republic of Korea |
| Website | http://www.kma.go.kr/ |
Contact(s)
| Name | SE-HWAN YANG |
|---|---|
| Prefix | |
| ysh82@korea.kr | |
| Organization No | 39 |
| Organization acronym | KMA |
| Organization name | Korea Meteorological Administration |
| Organization country/territory | Republic of Korea |
| Address 1 | |
| Address 2 | |
| Address 3 | 33, Seohobuk-ro, Seoqwipo. Jeju, 63568, Rep. of KOREA |
| Country/territory | Republic of Korea |
| Tel | 82707806647 |
| Fax | |
| Last updated date | 2025-08-01 |
|
|||||||
| Background observation | |||||||
| UTC | |||||||
| ppm | |||||||
|
9999-12-31 00:00:00 - 9999-12-31 23:59:59: KRISS |
|||||||
|
9999-12-31 00:00:00 - 9999-12-31 23:59:59: G1200, Picarro Inc, USA(CRDS) |
|||||||
|
9999-12-31 00:00:00 - 9999-12-31 23:59:59: 6 (m) |
|||||||
| Unknown | |||||||
| KRISS (Korea Research Institute of Standard Sciences) | |||||||
| The raw data is stored on the CRDS PC at intervals of < 2 seconds. CO2 concentration is checked at the site or remotely by operators. All activities, may influence the measurement, are recorded and used for quality control.Routine calibration at the interval of 15 days are carried out. Data are backed up and analyzed at the station first. Finally, the data are checked and validated by the contributor at KOPRI. | |||||||
|
[Hourly] 30-second data are taken from the arithmetic mean of raw data. Median is determined every 10 minutes from the 30-second data. The median are removed when black carbon concentration is > 100 ng/m3 or wind direction is in the range of 330 - 60 degree.One hourly data are taken from the arithmetic mean of 10-minute median. [Daily] Daily data are taken from the arithmetic mean of background hourly data. [Monthly] Monthly data are taken from the arithmetic mean of background hourly data. |
|||||||
| Temporarily suspended | |||||||
|
The observatory building is located on the northwest edge of the Barton Peninsula of King George Island. The area is surrounded by Maxwell Bay(northwest) and Marian Cove(northeast). While the land surface around the observatory building is non-glaciated and exposed in summer, glacier is widespread located except around the station. Overall, marine biological production is relatively active in summer. In the meawhile, sea ice forms or the sea is covered with drift ices in winter. There are several year-round stations in the King George Island, one of the densely inhabitated area on Antarctica. Atmosphere over the area is, however, considered free of anthropogenic influence except local contamination source for the maintenance of the station. The measurement system consists of inlet outside the observatory building, diaphrame pump, dehumidifier, mass flow controller and the CRDS inside the building. Sampled air moves from the inlet to the CRDS through decarbon tube with a diameter of 3/8". Flow rate into the CRDS is controlled 250 ml min-1 by the mass flow controller. Nephion dryer, 25 cm in length and chemical trap using Mg(ClO4)2 are used to remove water vapor in the sample. The aim of the measurement is to monitor long term variation of CO2 concentration near the Antarctic Peninsula, experiencing relatively rapid climate change and to provide data, which can be used with data from other areas to understand the role of the Sourthern Ocean for atmospheric CO2. |
|||||||
|
Wind direction: Wind speed: Relative humidity: Precipitation amount: Air pressure: Air temperature: Dew point temperature: Sea water temperature: Sea surface water temperature: Sea water salinity: Sea surface water salinity: |
|||||||
|
Meteorological data may remain as first provided, even when greenhouse gas data are updated. |
No DOI available
Related information
| Format | Text (WDCGG Data Format Table, WDCGG Meteorological Data Format Table), NetCDF | ||||
|---|---|---|---|---|---|
| Relation List (Is Part Of) |
All CO2 data contributed to WDCGG by GAW stations and mobiles by 2025-09-17 All CO2 data contributed to WDCGG by GAW stations and mobiles by 2024-09-24 All CO2 data contributed to WDCGG by GAW stations and mobiles by 2023-09-13 All CO2 data contributed to WDCGG by GAW stations and mobiles by 2022-09-07 All CO2 data contributed to WDCGG by GAW stations and mobiles by 2021-09-08 All CO2 data contributed to WDCGG by GAW stations and mobiles by 2020-09-28 All CO2 data contributed to WDCGG by GAW stations and mobiles by 2019-09-19 All CO2 data contributed to WDCGG by GAW stations and mobiles by 2018-10-25 |
||||
| Geolocation Point |
|
GAW Data Policy
"For Scientific purposes, access to these data is unlimited and provided without charge.
By their use you accept that an offer of co-authorship will be made through personal contact with the data providers
or owners whenever substantial use is made of their data.
In all cases, an acknowledgement must be made to the data providers or owners and to the data centre when these data are used within a publication."
Citation format
This format is an example of the WDCGG standard citation.
Please follow the citation format which the data providers or owners indicate.
Please follow the citation format which the data providers or owners indicate.
SE-HWAN YANG (KMA),
Atmospheric CO2
at King Sejong by Korea Meteorological Administration,
dataset published as CO2_KSG7001_surface-insitu_KMA_data1 at WDCGG,
ver. 2025-08-01-0951 (Reference date*: YYYY/MM/DD)
* As the reference date, please indicate the date you downloaded the files.
* As the reference date, please indicate the date you downloaded the files.


