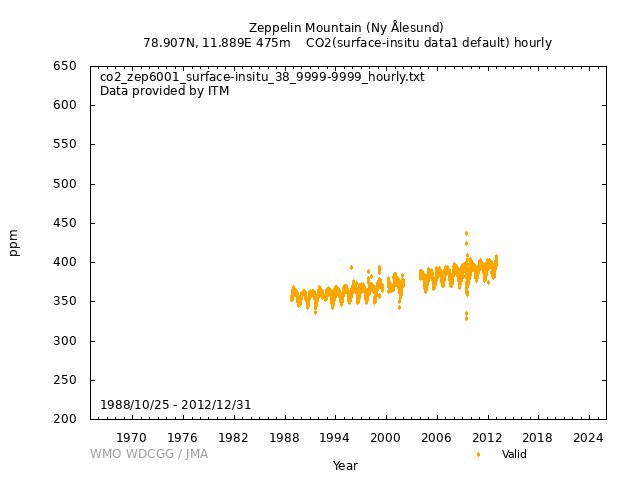
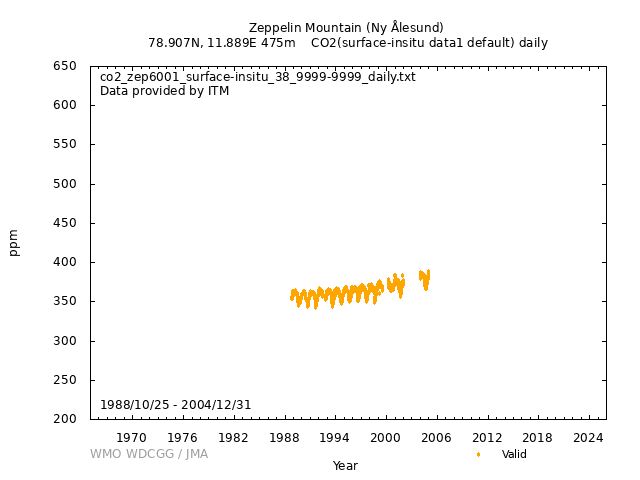
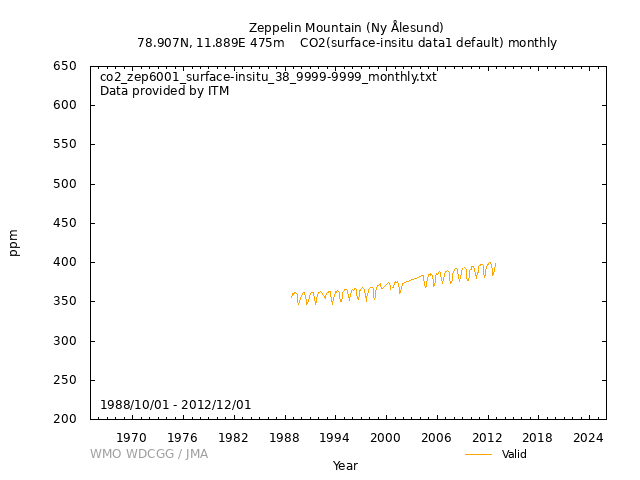
Data Policy
GAW Data Policy
"For Scientific purposes, access to these data is unlimited and provided without charge.
By their use you accept that an offer of co-authorship will be made through personal contact with the data providers
or owners whenever substantial use is made of their data.
In all cases, an acknowledgement must be made to the data providers or owners and to the data centre when these data are used within a publication."
Version
2025-01-01-0038 (Last updated: 2024-12-24)File
This data set is submitted by ITM.
In line with the GAW Data Policy, users should contact the contributors of all data of interest and propose co-authorship or acknowledgement.
Organization
| NO | 38 |
|---|---|
| Acronym | ITM |
| Name | Department of Applied Environmental Science, Stockholm University |
| Address 1 | |
| Address 2 | |
| Address 3 | Department of Environmental Science and Analytical Chemistry (ACES) Stockholm University 106 91 Stockholm |
| Country/Territory | Sweden |
| Website | http://www.itm.su.se |
Contact(s)
| Name | Hans-Christen |
|---|---|
| Prefix | Prof. |
| hc@itm.su.se | |
| Organization No | 38 |
| Organization acronym | ITM |
| Organization name | Department of Applied Environmental Science, Stockholm University |
| Organization country/territory | Sweden |
| Address 1 | |
| Address 2 | Department of Applied Environmental Science (ITM) Stockholm University |
| Address 3 | SE-10691 Stockholm |
| Country/territory | Sweden |
| Tel | +46 8 674 7290 |
| Fax | +46 8 674 7325 |
| Last updated date | 2018-07-16 |
| Name | Birgitta Noone |
|---|---|
| Prefix | Ms. |
| birgitta.noone@itm.su.se | |
| Organization No | 38 |
| Organization acronym | ITM |
| Organization name | Department of Applied Environmental Science, Stockholm University |
| Organization country/territory | Sweden |
| Address 1 | |
| Address 2 | Department of Applied Environmental Science (ITM) Stockholm University |
| Address 3 | SE-10691 Stockholm |
| Country/territory | Sweden |
| Tel | +46 8 674 7252 |
| Fax | +46 8 674 7325 |
| Last updated date | 2025-08-18 |
| Background observation | |
| UTC | |
| ppm | |
|
2007-01-01 00:00:00 - 9999-12-31 23:59:59: WMO CO2 X2007 |
|
|
9999-12-31 00:00:00 - 1996-12-31 23:59:59: UNOR 4N(NDIR) 1997-01-01 00:00:00 - 2004-12-31 23:59:59: LiCOR 6251(NDIR) 2005-01-01 00:00:00 - 9999-12-31 23:59:59: LiCOR 7000(NDIR) |
|
| 1 minute | |
|
Scale: WMO mole fraction scale. For data from 2007 the WMO X2007 scale. The working standards used at the station are calibrated several times before and after use at the station. This is done in the lab in Stockholm against a set of 5 lab standards. The Lab standards are in turn calibrated against a set of 6 NOAA standards. The NOAA standards were last calibrated at the WMO GAW CCL in Boulder, CO in 2007. The measurements are spanned by a set of 3 standards that are analyzed at a two hour interval. Each calibration takes ca 15 minutes so the calibration times changes every day. A target gas is introduced during service visits at the station, typically every 3-4 months. |
|
| From 2004: The raw data is stored as one minute averages by the data acquisition system. The minute averages are converted to physical units using the calibration data and a linear fit to the spanning standards. | |
|
[Hourly] Until 2002: Instrument delivers one-minute averages. The reported hourly values are the median over at least 5 one-minute averages. Only data with an hourly standard deviation less than, or equal, 0.2 ppm are reported. For some periods one-minute are not available, these data are instead read from a strip chart. In this case no standard deviation is reported, and the values is given a higher uncertainty. From 2004: The hourly data is calculated from the 1 minute averages. Any data wich is erronious is then excluded (eg. confirmed instrument error, contaminations, calibrations and other service). [Daily] Daily data is calculated from the one minute averages as for the hourly data. [Monthly] Monthly data is calculated from the one minute averages as for the hourly data. The average data from 1988 to 2005 were calculated by WDCGG. |
|
| After 2004 the flags used are those for CARBOEurope: ... means data is OK, *.. data is missing or erroneous, X.. means data is suspicious and has to be looked at further, D.W means the drying unit was off line, the sample is "wet". | |
| Temporarily suspended | |
|
Continuous flow of 2 liters per minute (ppm), and data is saved as one minute averages Other description for sampling and analyses Ambient air enters the station through a 3/8” OD Dekoron Type 1300 tubing at a flow of 2 (lpm). The inlet is situated ca. 3 meters above the roof of the Zeppelin station. The length of the tubing is ca. 12 meters. The air then passes through a NITTO piston pump, and then enters a set of drying tubes (total 0.6 meters) filled with magnesium perchlorate. After the dryers the air flows through at 1/8 inch steel tube at 0.1 lpm to the analysis instrument. |
|
|
Wind direction: Wind speed: Relative humidity: Precipitation amount: Air pressure: Air temperature: Dew point temperature: Sea water temperature: Sea surface water temperature: Sea water salinity: Sea surface water salinity: |
|
|
Meteorological data may remain as first provided, even when greenhouse gas data are updated. |
No DOI available
Related information
GAW Data Policy
"For Scientific purposes, access to these data is unlimited and provided without charge.
By their use you accept that an offer of co-authorship will be made through personal contact with the data providers
or owners whenever substantial use is made of their data.
In all cases, an acknowledgement must be made to the data providers or owners and to the data centre when these data are used within a publication."
Citation format
This format is an example of the WDCGG standard citation.
Please follow the citation format which the data providers or owners indicate.
Please follow the citation format which the data providers or owners indicate.
Hans-Christen (ITM),
Birgitta Noone (ITM),
Atmospheric CO2
at Zeppelin Mountain (Ny Ålesund) by Department of Applied Environmental Science, Stockholm University,
dataset published as CO2_ZEP6001_surface-insitu_ITM_data1 at WDCGG,
ver. 2025-01-01-0038 (Reference date*: YYYY/MM/DD)
* As the reference date, please indicate the date you downloaded the files.
* As the reference date, please indicate the date you downloaded the files.


