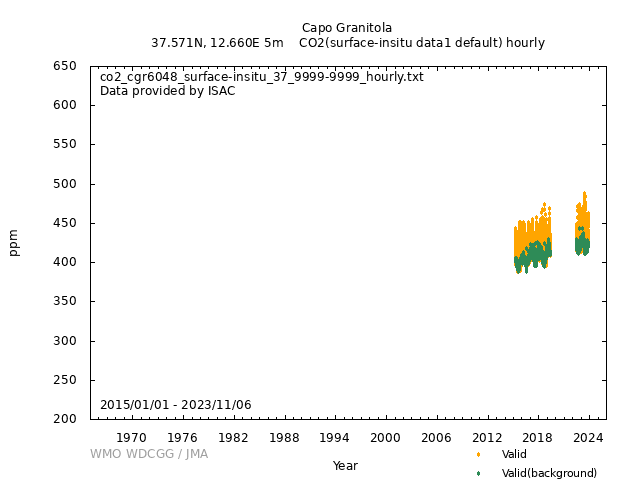
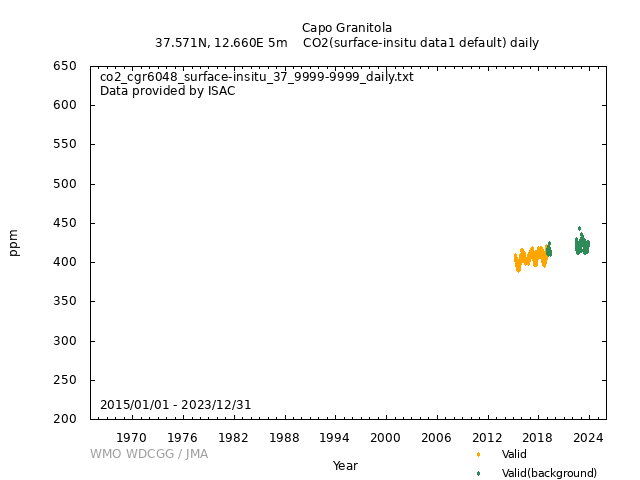
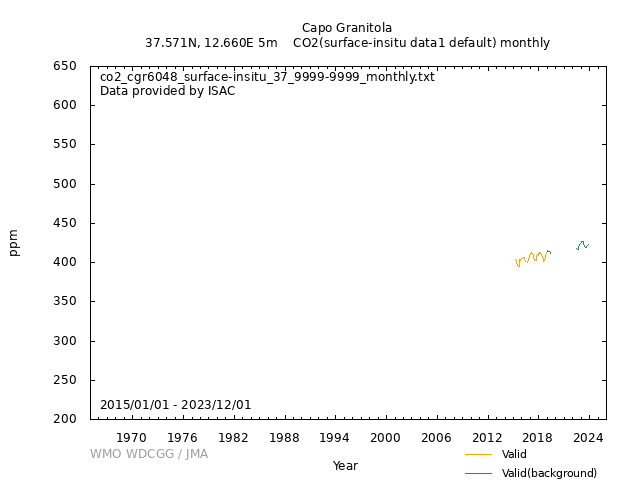
Data Policy
GAW Data Policy
"For Scientific purposes, access to these data is unlimited and provided without charge.
By their use you accept that an offer of co-authorship will be made through personal contact with the data providers
or owners whenever substantial use is made of their data.
In all cases, an acknowledgement must be made to the data providers or owners and to the data centre when these data are used within a publication."
Version
2025-01-01-0037 (Last updated: 2024-12-24)File
This data set is submitted by ISAC.
In line with the GAW Data Policy, users should contact the contributors of all data of interest and propose co-authorship or acknowledgement.
Organization
| NO | 37 |
|---|---|
| Acronym | ISAC |
| Name | National Research Council, Institute of Atmospheric Sciences and Climate |
| Address 1 | |
| Address 2 | |
| Address 3 | Via Piero Gobetti, 101 40129 BOLOGNA (IT) |
| Country/Territory | Italy |
| Website | http://www.isac.cnr.it |
Contact(s)
| Name | Paolo Cristofanelli |
|---|---|
| Prefix | |
| p.cristofanelli@isac.cnr.it | |
| Organization No | 37 |
| Organization acronym | ISAC |
| Organization name | National Research Council, Institute of Atmospheric Sciences and Climate |
| Organization country/territory | Italy |
| Address 1 | |
| Address 2 | |
| Address 3 | ISAC-CNR, VIa Gobetti 101 - 40129 Bologna, Italy |
| Country/territory | Italy |
| Tel | +39 051 6399652 |
| Fax | +39 051 6399652 |
| Last updated date | 2025-10-20 |
| Name | Ignazio Fontana |
|---|---|
| Prefix | |
| ignazio.fontana@cnr.it | |
| Organization No | 138 |
| Organization acronym | IASCNR |
| Organization name | Istituto per lo studio degli impatti Antropici e Sostenibilità in ambiente marino |
| Organization country/territory | Italy |
| Address 1 | |
| Address 2 | |
| Address 3 | |
| Country/territory | Italy |
| Tel | +39 0924 40600 |
| Fax | +39 0924 40445 |
| Last updated date | 2024-05-06 |
| Name | Giorgio Tranchida |
|---|---|
| Prefix | |
| giorgio.tranchida@cnr.it | |
| Organization No | 138 |
| Organization acronym | IASCNR |
| Organization name | Istituto per lo studio degli impatti Antropici e Sostenibilità in ambiente marino |
| Organization country/territory | Italy |
| Address 1 | |
| Address 2 | |
| Address 3 | |
| Country/territory | Italy |
| Tel | +39 0924 40600 |
| Fax | +39 0924 40445 |
| Last updated date | 2024-05-06 |
| Name | Giovanni Giacalone |
|---|---|
| Prefix | |
| giovanni.giacalone@cnr.it | |
| Organization No | 138 |
| Organization acronym | IASCNR |
| Organization name | Istituto per lo studio degli impatti Antropici e Sostenibilità in ambiente marino |
| Organization country/territory | Italy |
| Address 1 | |
| Address 2 | |
| Address 3 | |
| Country/territory | Italy |
| Tel | +39 0924 40600 |
| Fax | +39 0924 40445 |
| Last updated date | 2024-05-06 |
| Name | Maurizio Busetto |
|---|---|
| Prefix | |
| m.busetto@isac.cnr.it | |
| Organization No | 37 |
| Organization acronym | ISAC |
| Organization name | National Research Council, Institute of Atmospheric Sciences and Climate |
| Organization country/territory | Italy |
| Address 1 | |
| Address 2 | |
| Address 3 | |
| Country/territory | Italy |
| Tel | |
| Fax | |
| Last updated date | 2025-10-20 |
| Name | Francescopiero Calzolari |
|---|---|
| Prefix | |
| f.calzolari@isac.cnr.it | |
| Organization No | 37 |
| Organization acronym | ISAC |
| Organization name | National Research Council, Institute of Atmospheric Sciences and Climate |
| Organization country/territory | Italy |
| Address 1 | |
| Address 2 | |
| Address 3 | |
| Country/territory | Italy |
| Tel | |
| Fax | |
| Last updated date | 2025-10-20 |
|
|||||||
| Monitoring background conditions, and the influence of air pollution | |||||||
| UTC+01:00 | |||||||
| ppm | |||||||
|
9999-12-31 00:00:00 - 9999-12-31 23:59:59: WMO CO2 X2019 |
|||||||
|
9999-12-31 00:00:00 - 9999-12-31 23:59:59: Picarro G2401 (S/N: CFKADS2152-20141128)(CRDS) |
|||||||
|
9999-12-31 00:00:00 - 9999-12-31 23:59:59: 4 (m) |
|||||||
| 5 seconds | |||||||
| Until 2016, the CGR system was manually calibrated every three months by using a set of 6 commercial standards (synthetic air) traced back to a set of n.3 calibration standard from NOAA-GMDL (CB11039, CB11164, CB10928). Each calibration event included three single injections (60 minute each). Starting from 2017, a NOAA-GMDL standard (ND01759, provided by ENEA, Laboratory for Observations and Analyses of Earth and Climate, Lampedusa.) was available at CGR and was used to calibrate the measurements each month (each week starting from 2018) by scaling the measured concentration. To minimise the mixture consumption, a single injection is performed every week (duration: 45 minutes). The injection of standard is followed by the injection (45 minutes each) of two target gases (real air matrix). Starting from 1st June 2022, two real-air matrix calibration standards linked to WMO standards and one short-term target gases were used. Three cycle of calibration injections are carried out every 7 days, while target gas is injected every 24 hours. | |||||||
|
Data are recorded on a 5 s basis by the Picarro internal PC and mirrored to a station server, then delivered in NRT mode to ISAC-CNR HQ in Bologna, where 1-minute averages were calculated. An outlier rejection methodology (based on that described by El Yazidi et al., AMT, 2018) is applied to the 1-minute time series before calculation of hourly average values. On an hourly basis standard deviation values data were flagged to identify local contamination (see Data Quality Flag). For all the instruments and Observatories, information on instrument functioning and intervention are stored in an e-logbook. 1-minute data and metadata are visually inspected on a daily basis by an HTML page reporting the last 48h of available measurements and instrumental internal parameters. Data and metadata are further analyzed on a monthly/seasonal/quaterly basis. Final aggregation to hourly average are executed using validated 1-minute data (i.e. by excluding calibration records, missed records and local-contaminated records). Quality assurance procedures involve time series plots, consistency checks on co-variability with other gas parameters, meteorology and aerosol for special events. |
|||||||
|
[Hourly] [Daily] YEAR 2015-2016 Daily mean values were obtained by averaging hourly mean data flagged as "...L" or "...S". YEAR 2017 - onwards Daily mean values were obtained by averaging hourly mean data with standard deviation lower than 0.3 ppm [Monthly] YEAR 2015-2016 Monthly means are produced by first averaging all hourly mean values flagged as "...L" or "...S" on a weekly basis and these weekly values are averaged for each month to give the monthly means. YEAR 2017 - onwards Monthly means are produced by first averaging daily mean values on a weekly basis and these weekly values are averaged for each month to give the monthly means. |
|||||||
|
YEAR 2015-2016 "I..." missed data ".V.." large variability of CO2 within one hour (hourly CO2 standard deviation larger than 0.30 ppm) "..D." hour-to-hour difference higher than 0.25 ppm "...L" data recorded under land breeze wind regime "...S" data recorded under sea breeze wind regime YEAR 2017- onwards Flag 0.390 indicates data completeness under 50% for 1-hour mean value calculation. Flag 0.559 indicates not-background influence. Flag 0.999 indicates missing data. |
|||||||
|
Valid: .L. Invalid: I... Valid: ..L. Invalid: ...E Valid: ...L Valid: .V.S Valid: ..D. Valid (background): .S. Valid: .LV Valid: .SV Valid: .VD. Valid (background): ... Valid: ..V Valid: .VDL Valid: .V.L Valid: .VDS Valid: ..DS Valid: ..DL Valid (background): ...S Valid (background): 0.0000 Valid: 0.5590 Valid: 0.3900 Valid: 0.4600 Invalid: 0.9990 Valid: .VLB Valid: .VL. Valid (background): ..S. Valid: .VSB Valid: .VS. Valid (background): .... Valid: .V.. Invalid: I.. |
|||||||
| Operational/Reporting | |||||||
|
Capo Granitola Observatory is located along the southern Sicily coastline facing the Strait of Sicily, at Torretta Granitola (12 km from Mazara del Vallo, 52,000 inhabitants), within the scientific campus of the Institute for the Marine-Coastal Environment (CNR-IAMC). CGR location is affected by the sea-land breeze regime, with prevailing gentle wind breezes (up to 4 m/s) from inland (NW-NE) during the night and prevailing winds from the sea (W-SE) during daytime. CO2 observations are performed with a commercially available instrument (Picarro Inc. G2401) based on the Wavelength-Scanned Cavity Ringdown Spectroscopy technique coupled to a custom-built calibration unit. Along with CO2, the instrument is also capable to measure CO, CH4 and H2O. Thus, the CO2 data can be corrected for interferences of remaining water traces. CO2 reading were further corrected for water vapor intereference by using the empirical humidity correction provided by Chen et al. AMT, 2010. The air intake is composed of a Teflon tube (length: 2600 mm) with 50 mm inner diameter. An upper hood (Teflon-coated) is used to prevent rain penetration inside the sampling intake. Air is sampled 1.5 m above the station roof. Internal temperature and relative humidity are continuously monitored and temperature is keep 4 Celsius degrees higher than ambient temperature to prevent condensation. Flow is maintained constant minimizing (below 5 s) the residence time of sampling inside the air intake. Flow as well as internal T and RH are continuously monitored and recorded by the acquisition system. 1/4” (OD) Synflex 1300 tubes is used to connect the air intake manifold. |
|||||||
|
Wind direction: Wind speed: Relative humidity: Precipitation amount: Air pressure: Air temperature: Dew point temperature: Sea water temperature: Sea surface water temperature: Sea water salinity: Sea surface water salinity: |
|||||||
|
Meteorological data may remain as first provided, even when greenhouse gas data are updated. |
DOI Metadata
| DOI |
|
||||||||||||
|---|---|---|---|---|---|---|---|---|---|---|---|---|---|
| Version |
2025-01-01-0037 (Data Version History) * DOIs and file names may have multiple versions. Be sure to check the data version. |
||||||||||||
| Title | Atmospheric CO2 at Capo Granitola by National Research Council, Institute of Atmospheric Sciences and Climate, dataset published as CO2_CGR6048_surface-insitu_ISAC_data1 at WDCGG | ||||||||||||
| Creator |
National Research Council, Institute of Atmospheric Sciences and Climate Paolo Cristofanelli (IASCNR) Ignazio Fontana (IASCNR) Giorgio Tranchida (IASCNR) Giovanni Giacalone (IASCNR) Maurizio Busetto (IASCNR) Francescopiero Calzolari (IASCNR) |
||||||||||||
| Publisher | World Data Centre for Greenhouse Gases | ||||||||||||
| Publication Date | 2018-06-14 (Last Updated: 2024-12-24) | ||||||||||||
| Format | Text (WDCGG Data Format Table, WDCGG Meteorological Data Format Table), NetCDF | ||||||||||||
| Relation List (Is Part Of) |
All CO2 data contributed to WDCGG by GAW stations and mobiles by 2025-09-17 All CO2 data contributed to WDCGG by GAW stations and mobiles by 2024-09-24 All CO2 data contributed to WDCGG by GAW stations and mobiles by 2023-09-13 All CO2 data contributed to WDCGG by GAW stations and mobiles by 2022-09-07 All CO2 data contributed to WDCGG by GAW stations and mobiles by 2021-09-08 All CO2 data contributed to WDCGG by GAW stations and mobiles by 2020-09-28 All CO2 data contributed to WDCGG by GAW stations and mobiles by 2019-09-19 All CO2 data contributed to WDCGG by GAW stations and mobiles by 2018-10-25 |
||||||||||||
| Geolocation Point |
|
GAW Data Policy
"For Scientific purposes, access to these data is unlimited and provided without charge.
By their use you accept that an offer of co-authorship will be made through personal contact with the data providers
or owners whenever substantial use is made of their data.
In all cases, an acknowledgement must be made to the data providers or owners and to the data centre when these data are used within a publication."
Citation format
This format is an example of the WDCGG standard citation.
Please follow the citation format which the data providers or owners indicate.
Please follow the citation format which the data providers or owners indicate.
Paolo Cristofanelli (ISAC),
Ignazio Fontana (IASCNR),
Giorgio Tranchida (IASCNR),
Giovanni Giacalone (IASCNR),
Maurizio Busetto (ISAC),
Francescopiero Calzolari (ISAC),
Atmospheric CO2
at Capo Granitola by National Research Council, Institute of Atmospheric Sciences and Climate,
dataset published as CO2_CGR6048_surface-insitu_ISAC_data1 at WDCGG,
ver. 2025-01-01-0037, https://doi.org/10.50849/WDCGG_0037-6048-1001-01-01-9999 (Reference date*: YYYY/MM/DD)
* As the reference date, please indicate the date you downloaded the files.
* As the reference date, please indicate the date you downloaded the files.
Reference(s)
| 1 | Cristofanelli P, Busetto M, Calzolari F, Ammoscato I, Gullì D, Dinoi A, et al.. Investigation of reactive gases and methane variability in the coastal boundary layer of the central Mediterranean basin. Elem Sci Anth. 2017;5:12. DOI: http://doi.org/10.1525/elementa.216 |
|---|


