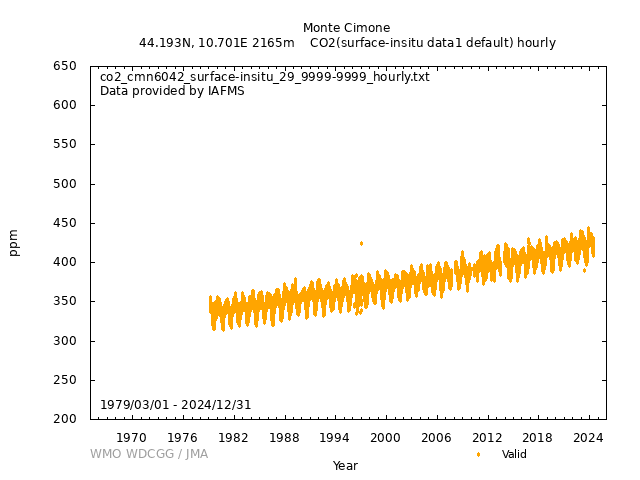
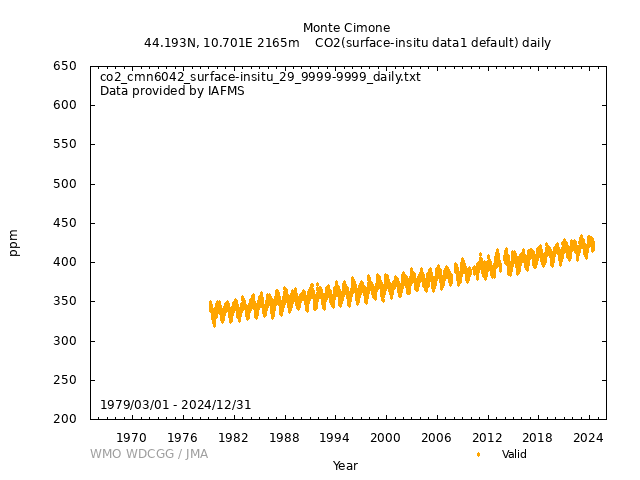
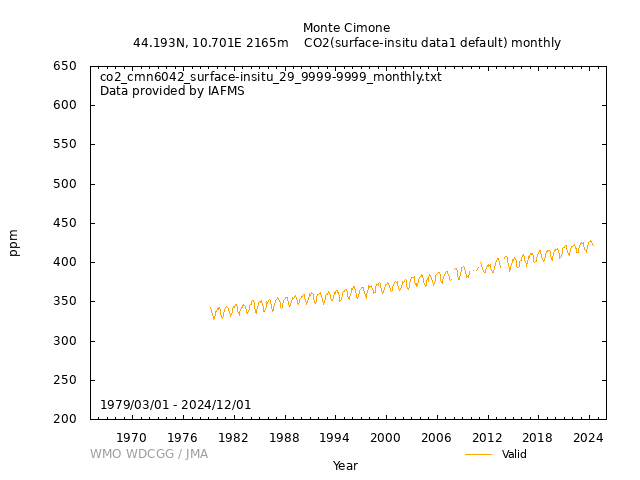
Data Policy
GAW Data Policy
"For Scientific purposes, access to these data is unlimited and provided without charge.
By their use you accept that an offer of co-authorship will be made through personal contact with the data providers
or owners whenever substantial use is made of their data.
In all cases, an acknowledgement must be made to the data providers or owners and to the data centre when these data are used within a publication."
Version
2025-01-01-0029 (Last updated: 2024-12-24)File
This data set is submitted by IAFMS.
In line with the GAW Data Policy, users should contact the contributors of all data of interest and propose co-authorship or acknowledgement.
Organization
| NO | 29 |
|---|---|
| Acronym | IAFMS |
| Name | Italian Air Force Mountain Centre |
| Address 1 | Via Delle Ville, 40, 41029 Sestola (MO) |
| Address 2 | |
| Address 3 | |
| Country/Territory | Italy |
| Website | http://www.meteoam.it/ |
Contact(s)
| Name | Stefano Amendola |
|---|---|
| Prefix | |
| stefano.amendola@aeronautica.difesa.it | |
| Organization No | 29 |
| Organization acronym | IAFMS |
| Organization name | Italian Air Force Mountain Centre |
| Organization country/territory | Italy |
| Address 1 | Via Delle Ville, 40, 41029 Sestola (MO) |
| Address 2 | |
| Address 3 | |
| Country/territory | Italy |
| Tel | |
| Fax | |
| Last updated date | 2025-04-16 |
| Name | Felice Dipace |
|---|---|
| Prefix | |
| felice.dipace@aeronautica.difesa.it | |
| Organization No | 29 |
| Organization acronym | IAFMS |
| Organization name | Italian Air Force Mountain Centre |
| Organization country/territory | Italy |
| Address 1 | Via Delle Ville, 40, 41029 Sestola (MO) |
| Address 2 | |
| Address 3 | |
| Country/territory | Italy |
| Tel | |
| Fax | |
| Last updated date | 2025-04-16 |
| Name | Luigi Lauria |
|---|---|
| Prefix | |
| luigi.lauria@aeronautica.difesa.it | |
| Organization No | 29 |
| Organization acronym | IAFMS |
| Organization name | Italian Air Force Mountain Centre |
| Organization country/territory | Italy |
| Address 1 | Via Delle Ville, 40, 41029 Sestola (MO) |
| Address 2 | |
| Address 3 | |
| Country/territory | Italy |
| Tel | |
| Fax | |
| Last updated date | 2025-04-16 |
| Background observation | |
| UTC+01:00 | |
| ppm | |
|
1979-03-01 00:00:00 - 2010-12-31 23:59:59: WMO CO2 X1993 2011-01-01 00:00:00 - 9999-12-31 23:59:59: WMO CO2 X2019 |
|
|
1979-03-01 00:00:00 - 2010-04-30 23:59:59: Ultramat Siemens 5-E(NDIR) 2010-05-01 00:00:00 - 2015-05-31 23:59:59: Ultramat Siemens 6-E(NDIR) 2015-06-01 00:00:00 - 9999-12-31 23:59:59: Picarro G2301(CRDS) |
|
|
9999-12-31 00:00:00 - 9999-12-31 23:59:59: 12 (m) |
|
| 5 seconds | |
|
The instrument is calibrated against three standards. The instrument output CO2 concentration signal is compared to the referenced standards. Due to the linear response guaranteed by the instrument, the calibration consists in finding a linear relation between the instrument signal and the standards. The calibration procedure is repeated about every three months or at higher frequency if some problems related to the instrument come in evidence. The comparison between the instrument response and the referenced standard is performed twice for every calibration procedure: the first time the instrument is fed with increasing CO2 concentration standards, while the second it is fed by decreasing them. |
|
|
The analyzer samples the CO2 concentration at 5 seconds intervals, which are aggregated in 10-minute averages, which are manually corrected. 10-minute averages corrected are used to calculate hourly averages, which are, in turn, used to compute daily averages. From daily averages we calculate monthly averages. We also apply a data selection procedure. Just some of the hourly averages originated by manually corrected 10-minute values are chosen to compute daily averages (these daily values differ from previous daily values). Selection procedure is illustrated in section "processing on hourly data". Daily data obtained after selection procedure are used to compute monthly values. |
|
|
[Hourly] The hourly averages are selected by an adapted Thoning et al. [1989]Mauna Loa procedure in order to consider only background hourly values when definitive daily averages are performed. The selection procedure is characterized by 6 steps plus another step applied only in summertime: 1. Temporary rejection of hourly averages with a standard deviation larger than 0.35 ppm. 2. Temporary rejection of every hourly average with a difference higher than 0.3 ppm respect to the previous one. 3. Temporary rejection of data from 9 to 21 due to local vegetation effects (only in summertime). 4. Application of a cubic spline in order to fit daily averages computed from hourly values not previously rejected. 5. Temporary rejection, for each day, of those hourly concentrations which differed from the curve by more than twice the standard deviation for that day. 6. Readmition of each rejected hourly value in steps 1-2-3 far from the curve less than 0.4 ppm at the day relative to that hourly value. 7. Repetition of steps 4, 5 and 6 until no hourly values are removed or added. [Daily] [Monthly] |
|
| Flag '8' means normal value | |
|
Valid: 8 |
|
| Operational/Reporting | |
|
Wind direction: 1 Wind speed: 1 Relative humidity: 0 Precipitation amount: 0 Air pressure: 0 Air temperature: 0 Dew point temperature: 0 Sea water temperature: 0 Sea surface water temperature: 0 Sea water salinity: 0 Sea surface water salinity: 0 |
|
|
Meteorological data may remain as first provided, even when greenhouse gas data are updated. |
No DOI available
Related information
GAW Data Policy
"For Scientific purposes, access to these data is unlimited and provided without charge.
By their use you accept that an offer of co-authorship will be made through personal contact with the data providers
or owners whenever substantial use is made of their data.
In all cases, an acknowledgement must be made to the data providers or owners and to the data centre when these data are used within a publication."
Citation format
This format is an example of the WDCGG standard citation.
Please follow the citation format which the data providers or owners indicate.
Please follow the citation format which the data providers or owners indicate.
Stefano Amendola (IAFMS),
Felice Dipace (IAFMS),
Luigi Lauria (IAFMS),
Atmospheric CO2
at Monte Cimone by Italian Air Force Mountain Centre,
dataset published as CO2_CMN6042_surface-insitu_IAFMS_data1 at WDCGG,
ver. 2025-01-01-0029 (Reference date*: YYYY/MM/DD)
* As the reference date, please indicate the date you downloaded the files.
* As the reference date, please indicate the date you downloaded the files.
Reference(s)
| 1 | Ciattaglia, L., V. Cundari and T. Colombo, 1987: Further measurements of Atmospheric carbon dioxide at Mt. Cimone, Italy: 1979-1985. Tellus, 39B, 13-20. |
|---|---|
| 2 | Cundari, V. and T. Colombo, 1986: Atmospheric carbon dioxide measurements at Mt. Cimone, (Italy) 1979-1983. Annales Geophysicae, 4, B, 1, 13-20. |
| 3 | Cundari, V., T. Colombo, G. Papini, G. Benedicti and L. Ciattaglia, 1990: Recent improvements on atmospheric CO2 measurements at Mt. Cimone Observatory. Il Nuovo Cimento, 13C, N.5, 871-872. |
| 4 | Colombo, T. and R. Santaguida, 1994: Atmospheric CO2 record from in situ measurements at Mt. Cimone. pp. 169-172. In T.A. Boden, D.P. Kaiser, R.J. Sepanski, and F.W. Stoss (eds.), Trends '93: A compendium of Data on Global Change. ORNL/CDIAC -65. Carbon Dioxide Information Analysis Center, Oak Ridge National Laboratory, Oak Ridge, Tenn., USA. |
| 5 | Cundari, V., T. Colombo and L. Ciattaglia, 1995: Thirteen years of atmospheric carbon dioxide measurements at Monte Cimone Station, Italy, IL NUOVO CIMENTO, 18c, N.1, 33-47. |
| 6 | Ciattaglia, L., 1983: Interpretation of atmospheric CO2 measurements at Mt. Cimone (Italy) related to wind data. J.Geophys.Res., 88, 1331-1338. |


