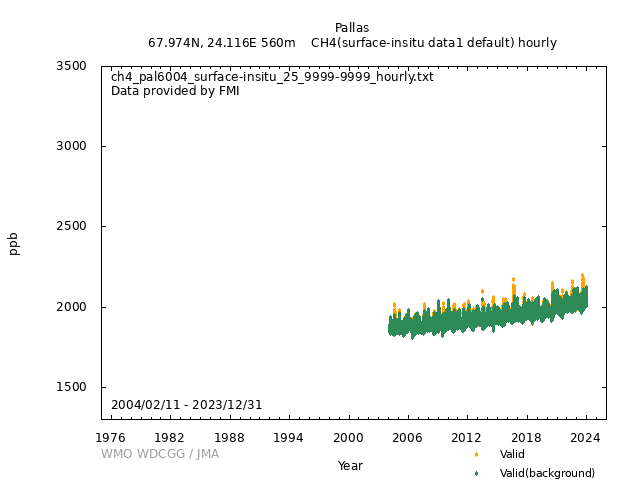
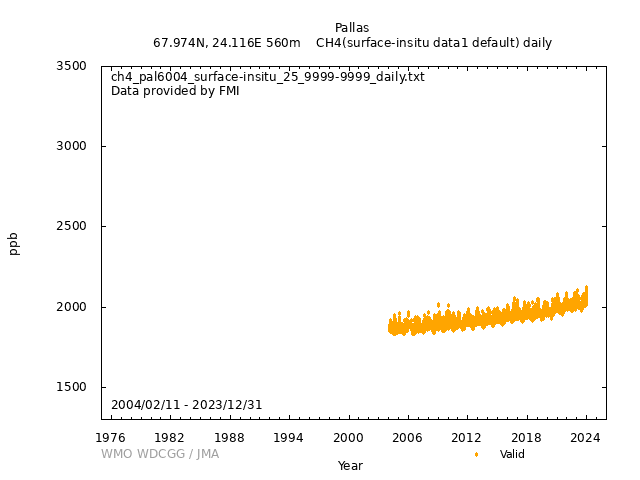
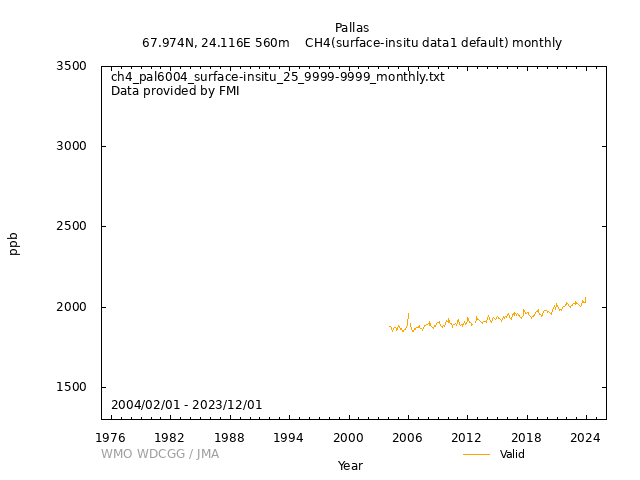
Data Policy
GAW Data Policy
"For Scientific purposes, access to these data is unlimited and provided without charge.
By their use you accept that an offer of co-authorship will be made through personal contact with the data providers
or owners whenever substantial use is made of their data.
In all cases, an acknowledgement must be made to the data providers or owners and to the data centre when these data are used within a publication."
Version
2025-01-01-0025 (Last updated: 2024-12-24)File
This data set is submitted by FMI.
In line with the GAW Data Policy, users should contact the contributors of all data of interest and propose co-authorship or acknowledgement.
Organization
| NO | 25 |
|---|---|
| Acronym | FMI |
| Name | Finnish Meteorological Institute |
| Address 1 | |
| Address 2 | |
| Address 3 | P.O. BOX 503 FI-00101 HELSINKI FINLAND |
| Country/Territory | Finland |
| Website | http://www.fmi.fi/en |
Contact(s)
| Name | Juha Hatakka |
|---|---|
| Prefix | |
| juha.hatakka@fmi.fi | |
| Organization No | 25 |
| Organization acronym | FMI |
| Organization name | Finnish Meteorological Institute |
| Organization country/territory | Finland |
| Address 1 | Finnish Meteorological Institute |
| Address 2 | Erik Palmenin aukio 1 |
| Address 3 | FI-00560 Helsinki, Finland |
| Country/territory | Finland |
| Tel | +358-29-539 5491 |
| Fax | +358-29-539 3503 |
| Last updated date | 2025-10-20 |
| Background observation | |
| UTC+02:00 | |
| ppb | |
|
9999-12-31 00:00:00 - 9999-12-31 23:59:59: WMO CH4 X2004A |
|
|
9999-12-31 00:00:00 - 2009-01-26 23:59:59: Agilent 6890N(Gas chromatography (FID)) 2009-01-27 00:00:00 - 2011-12-16 23:59:59: G1301 (Picarro)(CRDS) 2011-12-17 00:00:00 - 2012-06-10 23:59:59: G2401 (Picarro)(CRDS) 2012-06-11 00:00:00 - 2012-10-17 23:59:59: G1301 (Picarro)(CRDS) 2012-10-18 00:00:00 - 9999-12-31 23:59:59: G2401 (Picarro)(CRDS) |
|
|
9999-12-31 00:00:00 - 9999-12-31 23:59:59: 7 (m) |
|
| 1 minute | |
|
The GC had one working standard (WS), which was calibrated against WMO/CCL standards at the station ca. 5 times a year. Ambient sample and WS were measured either alternately, or two ambient samples followed by WS. Each measurement took 7.5 minutes. The CRDS system has one working standard (WS) cylinder, and one target (T) cylinder. WS cylinder is measured ca. 4 times a day, and T cylinder once a day. WS cylinder readings are used to compensate analyzer drift (response changes). Station standards have been calibrated several times at the station against other WMO/CCL standard sets. Currently the scale is based on 2018 recalibrated WMO/CCL set. |
|
|
GC chromatograms were automatically integrated, and CH4 peak height (with peak width, retention time, and area) stored. Sample/WS peak height ratio was calculated for each ambient sample measurement. This ratio was converted into mixing ratio with (linear) equation determined with calibrations, which were made ca. 5 times a year. For CRDS system the raw data is calculated to one minute averages, and these averages are calculated to mixing ratios by taking into account equation based on CRDS calibrations. Data is flagged automatically for abnormal values (outliers), and this flagging is checked later on (when final results are calculated) manually. |
|
|
[Hourly] Valid one minute mean values are averaged with standard deviations. [Daily] [Monthly] |
|
|
Hourly data before 2018 was flagged based on wind speed, hourly average standard deviations and 120 h back trajectories, which are calculated for every 3 hours. Since 2018 flagging is based only on wind speed and hourly standard deviation. Flags: M - missing value (or rejected due to system problems) Z - not classified: missing wind data (or trajectory data before 2018) X - not background air ("local"), value did not pass wind and/or standard deviation test 1 - marine background air (see below) 2 - continental background air (before 2010: trajectory >= 50% of the time over continent, 2010: trajectory < 20% of the time above sea) T - classification to marine or continental not possible Criteria for flag 'X': * wind speed <= 3.0 m/s during June-August, <= 4.0 m/s otherwise. * hourly stdev >= 3 ppb Additional criteria for flag '1' (marine): * polynomial+harmonic fit were made for the whole data period (2004->) for data for which trajectory is >=70% of the time over sea. This was used to determine standard deviation (9.6 ppb) between the fit and measured results. Hourly averages that are farther away than 2*stdev are flagged with 'T'. Additional criteria for flag '2' (continental): * As above, except for trajectory is <20% of the time over sea. Standard deviation is 21.5 ppb. Since 2010 data, source area (flags '1' and '2') analysis is based on dispersion model and footprints. Requirements for marine ('1'): less than 2% of the footprint is on continental areas, and in addition less than 20% on local area. For continental ('2') the requirement is less than 20% of the footprint is over marine areas. Since 2018 data trajectories have not been used in classification (no more '1' and '2' flags) |
|
|
Valid (background): 2 Valid (background): T Valid (background): 1 Valid: X Valid: Z Invalid: M |
|
| Operational/Reporting | |
|
The sample is taken from a common sampling line (inlet at the height of 7 m above ground, line made of acid resistant stainless steel OD 60 mm, flow speeed ca. 20 m/s) at 3 litres/minute and dried cryostatically to dewpoint ca. -25 C up The sample air of the CRDS (cavity ring-down spectroscopy) analyser is taken from the same common sampling line, and it is dried with a Nafion dryer (since 2009-05-07) to dewpoint ca. -20 C Since 2013-10-26 the CRDS system has no drying, i.e. ambient sample is measured as it is (wet). |
|
|
Wind direction: 1 Wind speed: 1 Relative humidity: 1 Precipitation amount: 0 Air pressure: 1 Air temperature: 1 Dew point temperature: 1 Sea water temperature: 0 Sea surface water temperature: 0 Sea water salinity: 0 Sea surface water salinity: 0 |
|
|
Meteorological data may remain as first provided, even when greenhouse gas data are updated. Anemometer height is 9 m a.g.l. Wind speed and direction is calculated (as vectors) from 1-minute values for the whole hour. |
No DOI available
Related information
GAW Data Policy
"For Scientific purposes, access to these data is unlimited and provided without charge.
By their use you accept that an offer of co-authorship will be made through personal contact with the data providers
or owners whenever substantial use is made of their data.
In all cases, an acknowledgement must be made to the data providers or owners and to the data centre when these data are used within a publication."
Citation format
This format is an example of the WDCGG standard citation.
Please follow the citation format which the data providers or owners indicate.
Please follow the citation format which the data providers or owners indicate.
Juha Hatakka (FMI),
Atmospheric CH4
at Pallas by Finnish Meteorological Institute,
dataset published as CH4_PAL6004_surface-insitu_FMI_data1 at WDCGG,
ver. 2025-01-01-0025 (Reference date*: YYYY/MM/DD)
* As the reference date, please indicate the date you downloaded the files.
* As the reference date, please indicate the date you downloaded the files.
Reference(s)
| 1 | The GC system (CH4,CO) was audited in 2007, and Picarro based system for CO2, CH4 and CO in 2012. See GAWSIS (https://gawsis.meteoswiss.ch/) |
|---|


