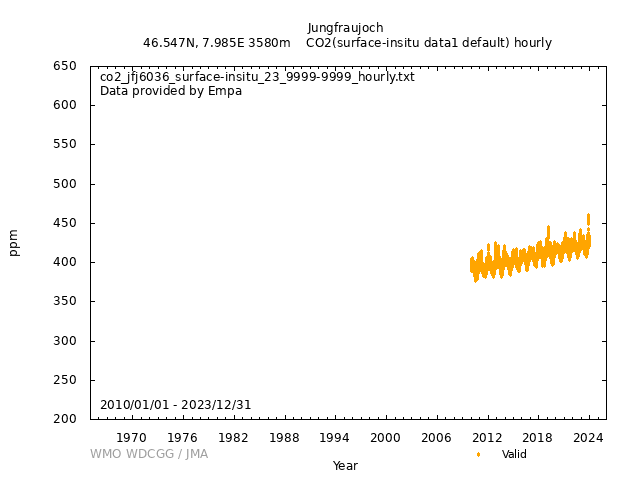
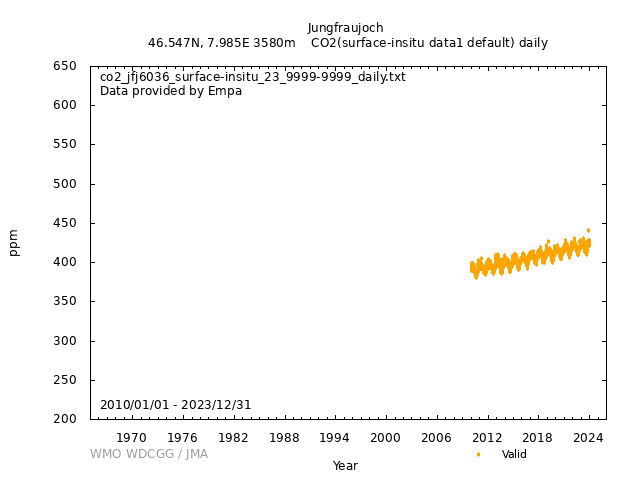
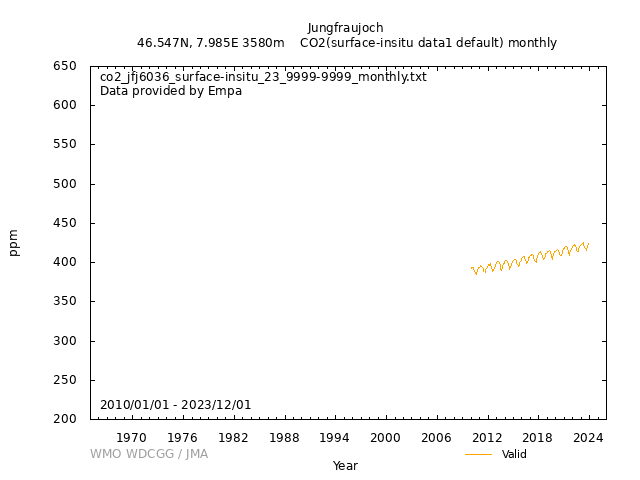
Data Policy
GAW Data Policy
"For Scientific purposes, access to these data is unlimited and provided without charge.
By their use you accept that an offer of co-authorship will be made through personal contact with the data providers
or owners whenever substantial use is made of their data.
In all cases, an acknowledgement must be made to the data providers or owners and to the data centre when these data are used within a publication."
Version
2025-07-08-1503 (Last updated: 2025-07-10)File
This data set is submitted by Empa.
In line with the GAW Data Policy, users should contact the contributors of all data of interest and propose co-authorship or acknowledgement.
Organization
| NO | 23 |
|---|---|
| Acronym | Empa |
| Name | Swiss Federal Laboratories for Materials Science and Technology |
| Address 1 | Überlandstrasse 129 |
| Address 2 | 8600 Dübendorf |
| Address 3 | Switzerland |
| Country/Territory | Switzerland |
| Website | http://www.empa.ch/gaw |
Contact(s)
| Name | Martin Steinbacher |
|---|---|
| Prefix | Dr. |
| martin.steinbacher@empa.ch | |
| Organization No | 23 |
| Organization acronym | Empa |
| Organization name | Swiss Federal Laboratories for Materials Science and Technology |
| Organization country/territory | Switzerland |
| Address 1 | Ueberlandstrasse 129 |
| Address 2 | CH-8600 Duebendorf |
| Address 3 | Switzerland |
| Country/territory | Switzerland |
| Tel | +41 58 765 4048 |
| Fax | |
| Last updated date | 2025-10-02 |
| Background observation | |
| UTC+01:00 | |
| ppm | |
|
9999-12-31 00:00:00 - 9999-12-31 23:59:59: WMO CO2 X2019 |
|
|
2010-01-01 00:00:00 - 2011-09-15 23:59:59: Picarro G1301(CRDS) 2011-09-16 00:00:00 - 9999-12-31 23:59:59: Picarro G2401(CRDS) |
|
|
9999-12-31 00:00:00 - 9999-12-31 23:59:59: 10 (m) |
|
| 5 seconds | |
|
Initially, calibrations are performed every 46 hours with two calibration gases. In addition, a target gas is analyzed every 15 hours to detect potential shorter term instrument sensitivity changes. mean precision for 20 mins of working standard analysis: about 0.01% from 3 December 2016 onwards: Three calibration gases are used. Calibration frequency is reduced to one a week but calibration sequence is now run 4 times in a row to identify/eliminate effects in the pressure regulators while sample refers stagnant for several days. Two target tanks are connected to timely identify instrumental or calibration issues. since December 2015: reference gases are prepared and analyzed by ICOS Central Calibration Laboratory in Jena, Germany. Until end of 2021, nominal values of the calibration gases traceable to WMO CO2 X2007 were used for determination of the calibrated data; in March 2021, all data (2010 till end of 2021) were converted to the WMO CO2 X2019 scale by applying the approximation CO2_X2019 = 1.00079 * CO2_X2007 - 0.142, according to CCL information (see https://www.esrl.noaa.gov/gmd/ccl/scale_conversion.html). For 2022 and onwards, final data were directly determined on the WMO CO2 X2019- by using new values of the calibration tanks assigned on the X2019 scale. |
|
|
Quality assurance procedures involve time series plots, consistency checks; the expanded measurement uncertainty is estimated to be: U_CO2 = 2 * ((0.0302 micromol mol-1)^2 + (1.81e-4 * c)^2)^(1/2) with c = CO2 mole fraction in micromol mol-1. which is largely determined by the uncertainty in the nominal values of the reference gases. Standard deviation of repeated target tank measurements is < 0.05 ppm. |
|
|
[Hourly] From 2014 onwards: number of detections refers to the number of available 5-second averages within the respective hour; data are discarded when less than 240 5-second averages are available for the respective hour [Daily] From 2014 onwards: number of detections refers to the number of available 1-min averages within the respective day From 2018 onwards: number of detections refers to the number of available hourly averages within the respective day [Monthly] From 2014 onwards: number of detections refers to the number of available 1-min averages within the respective month From 2018 onwards: number of detections refers to the number of available daily averages within the respective month |
|
| Operational/Reporting | |
|
Sampling Environment : high-alpine, measurements in pristine air, usually negligible local sources. Surfaces are mostly covered by snow or ice apart from some steep slopes of bare rock. No vegetation or soil present in the vicinity. Air intake : open-face, ambient Sampling and Analysis Frequency : data are continuously recorded in 2-sec (G1301)and 5-sec (G2401) intervals, respectively Description of Instruments : CO2 observations are performed with a commercially available instrument (Picarro Inc. G1301) based on the Wavelength-Scanned Cavity Ringdown Spectroscopy technique coupled to a custom-built calibration/drying unit. The sample air was dried prior to analysis by means of a Nafion dryer until August 2010. Along with CO2, the instrument is also capable to measure CH4 and H2O. Thus, the CO2 data can be corrected for interferences of remaining water traces. Since August 2010, no water vapor removal is used anymore and CO2 dry air mixing ratios are determined by application of an empirical humidity correction to the fully unaltered humid gas stream accounting for dilution and pressure broadening effects. The G1301 analyzer was replaced by a G2401 (Picarro Inc.) analyzer in September 2011. From 16 September 2011 until 01 November 2017 and since 25 October 2019 the sample air is dried prior to analysis by means of a Nafion dryer. |
|
|
Wind direction: 1 Wind speed: 1 Relative humidity: 1 Precipitation amount: 0 Air pressure: 1 Air temperature: 1 Dew point temperature: 0 Sea water temperature: 0 Sea surface water temperature: 0 Sea water salinity: 0 Sea surface water salinity: 0 |
|
|
Meteorological data may remain as first provided, even when greenhouse gas data are updated. Meteorological data at Jungfraujoch are measured by MeteoSwiss as part of its operation of the SwissMetNet Network. see www.meteoswiss.admin.ch/ and Appenzeller et al., Monitoring climate at Jungfraujoch in the high Swiss Alpine region, Science of The Total Environment, 391 (2-3), 262-268, https://doi.org/10.1016/j.scitotenv.2007.10.005 for more information. |
DOI Metadata
| DOI |
|
||||||||||||||||
|---|---|---|---|---|---|---|---|---|---|---|---|---|---|---|---|---|---|
| Version |
2025-07-08-1503 (Data Version History) * DOIs and file names may have multiple versions. Be sure to check the data version. |
||||||||||||||||
| Title | Atmospheric CO2 at Jungfraujoch by Swiss Federal Laboratories for Materials Science and Technology, dataset published as CO2_JFJ6036_surface-insitu_Empa_data1 at WDCGG | ||||||||||||||||
| Creator |
Swiss Federal Laboratories for Materials Science and Technology Martin Steinbacher (Empa) |
||||||||||||||||
| Publisher | World Data Centre for Greenhouse Gases | ||||||||||||||||
| Publication Date | 2018-07-06 (Last Updated: 2025-07-10) | ||||||||||||||||
| Format | Text (WDCGG Data Format Table, WDCGG Meteorological Data Format Table), NetCDF | ||||||||||||||||
| Relation List (Is Part Of) |
All CO2 data contributed to WDCGG by GAW stations and mobiles by 2025-09-17 All CO2 data contributed to WDCGG by GAW stations and mobiles by 2024-09-24 All CO2 data contributed to WDCGG by GAW stations and mobiles by 2023-09-13 All CO2 data contributed to WDCGG by GAW stations and mobiles by 2022-09-07 All CO2 data contributed to WDCGG by GAW stations and mobiles by 2021-09-08 All CO2 data contributed to WDCGG by GAW stations and mobiles by 2020-09-28 All CO2 data contributed to WDCGG by GAW stations and mobiles by 2019-09-19 All CO2 data contributed to WDCGG by GAW stations and mobiles by 2018-10-25 |
||||||||||||||||
| Geolocation Point |
|
GAW Data Policy
"For Scientific purposes, access to these data is unlimited and provided without charge.
By their use you accept that an offer of co-authorship will be made through personal contact with the data providers
or owners whenever substantial use is made of their data.
In all cases, an acknowledgement must be made to the data providers or owners and to the data centre when these data are used within a publication."
Citation format
This format is an example of the WDCGG standard citation.
Please follow the citation format which the data providers or owners indicate.
Please follow the citation format which the data providers or owners indicate.
Martin Steinbacher (Empa),
Atmospheric CO2
at Jungfraujoch by Swiss Federal Laboratories for Materials Science and Technology,
dataset published as CO2_JFJ6036_surface-insitu_Empa_data1 at WDCGG,
ver. 2025-07-08-1503, https://doi.org/10.50849/WDCGG_0023-6036-1001-01-01-9999 (Reference date*: YYYY/MM/DD)
* As the reference date, please indicate the date you downloaded the files.
* As the reference date, please indicate the date you downloaded the files.
Reference(s)
| 1 | Zellweger C., L. Emmenegger, M. Firdaus, J. Hatakka, M. Heimann, E. Kozlova, T. G. Spain, M. Steinbacher, M. V. van der Schoot, B. Buchmann, 2016 - Assessment of recent advances in measurement techniques for atmospheric carbon dioxide and methane observations, Atmospheric Measurement Techniques, 9, 4737-4757, doi:10.5194/amt-9-4737-2016. |
|---|---|
| 2 | Yver-Kwok C., C. Philippon, P. Bergamaschi, T. Biermann, F. Calzolari, H. Chen, S. Conil, P. Cristofanelli, M. Delmotte, J. Hatakka, M. Heliasz, O. Hermansen, K. Kominkova, D. Kubistin, N. Kumps, O. Laurent, T. Laurila, I. Lehner, J. Levula, M. Lindauer, M. Lopez, I. Mammarella, G. Manca, P. Marklund, J.-M. Metzger, M. Mölder, S. M. Platt, M. Ramonet, L. Rivier, B. Scheeren, M. K. Sha, P. Smith, M. Steinbacher, G. Vitkova, S. Wyss, 2021 - Evaluation and optimization of ICOS atmospheric station data as part of the labeling process, Atmospheric Measurement Techniques, 14, 89-116, https://doi.org/10.5194/amt-14-89-2021. |
| 3 | Schibig M. F., M. Steinbacher, B. Buchmann, I. van der Laan-Luijkx, S. Van der Laan, S. Ranjan, M. C. Leuenberger, 2015 - Comparison of continuous in-situ CO2 observations at Jungfraujoch using two different measurement techniques, Atmospheric Measurement Techniques,87, 57-68. |
| 4 | Pieber S. M., B. Tuzson, S. Henne, U. Karstens, C. Gerbig, F.-T. Koch, D. Brunner, M. Steinbacher, C. Emmenegger, 2022, Analysis of regional CO2 contributions at the high Alpine observatory Jungfraujoch by means of atmospheric transport simulations and δ13C, Atmospheric Chemistry and Physics, 22, 10721–10749, https://doi.org/10.5194/acp-22-10721-2022. |


