Data Policy
GAW Data Policy
"For Scientific purposes, access to these data is unlimited and provided without charge.
By their use you accept that an offer of co-authorship will be made through personal contact with the data providers
or owners whenever substantial use is made of their data.
In all cases, an acknowledgement must be made to the data providers or owners and to the data centre when these data are used within a publication."
Version
2025-04-07-0857 (Last updated: 2025-04-28)File
This data set is submitted by CMA.
In line with the GAW Data Policy, users should contact the contributors of all data of interest and propose co-authorship or acknowledgement.
Organization
| NO | 13 |
|---|---|
| Acronym | CMA |
| Name | China Meteorological Administration |
| Address 1 | 46 Zhongguancun S. Ave., Haidian Dist., Beijing, 100081, China |
| Address 2 | |
| Address 3 | |
| Country/Territory | China |
| Website |
Contact(s)
| Name | LIANG Miao |
|---|---|
| Prefix | |
| liangm@cma.gov.cn | |
| Organization No | 13 |
| Organization acronym | CMA |
| Organization name | China Meteorological Administration |
| Organization country/territory | China |
| Address 1 | |
| Address 2 | |
| Address 3 | |
| Country/territory | China |
| Tel | |
| Fax | |
| Last updated date | 2026-01-06 |
| Background observation | |
| UTC | |
| ppm | |
|
9999-12-31 00:00:00 - 9999-12-31 23:59:59: WMO CO2 X2019 |
|
|
1994-09-01 00:00:00 - 2008-12-31 23:59:59: Licor6251(NDIR) 2009-01-01 00:00:00 - 2010-06-30 23:59:59: Picarro G1301(CRDS) 2010-07-01 00:00:00 - 2016-06-30 23:59:59: Picarro G1301 & Picarro G1302(CRDS) 2016-07-01 00:00:00 - 9999-12-31 23:59:59: Picarro G2401(CRDS) |
|
|
9999-12-31 00:00:00 - 9999-12-31 23:59:59: 80 (m) |
|
| hourly | |
|
Licor6251 (NDIR): The standards of CO2 in clean dry air were used. The working gases (WH & WL) are automatically supplied to the analyzer at hourly intervals for correcting the analyzer drift, target gas (T) is introduced to check the system performance every day. The non-linear fitting curve is determined every 7 days by a set of 5 secondary standards. The CO2 mole fractions of WH, WL and T are determined by this fitting curve. Picarro G1301 & G1302 (CRDS): Two standards (WH & WL) of CO2 in air were used. The mole fraction is determined by the liner regression line determined every 480 minutes by the two working standards. To the reference gas (Target), the difference between the assigned mole fractions and the measured mole fractions is a measure of the overall system performance. Picarro G2401 (CRDS) Two standards of CH4 in Air were used. The mole fraction is determined by the liner regression line determined every 360 minutes by working gas (W). To the reference gas (Target), the differences between the assigned concentration and the measured mole fractions are used to evaluate the overall system performance. |
|
|
Licor6251 (NDIR): The raw data from the instrument is collected by the data acquisition system, and stored in the system as one minute raw data. The minutely raw data (typically 50 per hour) is converted to concentration data using calibration factors measured in the observation sequences. Invalid data caused by instrumental malfunction / some other abnormal factors (e.g. fire burning around etc.) are checked with information from the station logbook. Picarro G1301, G1302 & G2401 (CRDS): Raw data from the instruments were collected by the data acquisition system. Then it was identified by different gas streams and separated into 5 minutes cluster. The concentration routine dumps the first 3 minutes data and only uses the last 2 minutes average to calculate the concentration through the latest linearity regression factors. Invalid data caused by instrumental malfunction are checked with information from the station logbook. Ambient CO2 measurements are only included in the final data set if the re-evaluation of Target gas relative to the WH and WL within 0.2 ppm of its assigned value. The data out of this criterion are flagged by principal investigator (PI), which is deemed invalid. The data are also manually inspected and examined using quality control routines before being accepted as valid measurements. The CO2 data reported to WDCGG from 2009 to 2016 was mainly from G1301 or G2401. Part of data gaps of G1301 due to the system malfunction, maintains, calibration, etc. were synchronized and merged by that of the G1302. The comparison of data between G1301 and G1302 agrees very well with a bias of less than 0.1 ppm. |
|
|
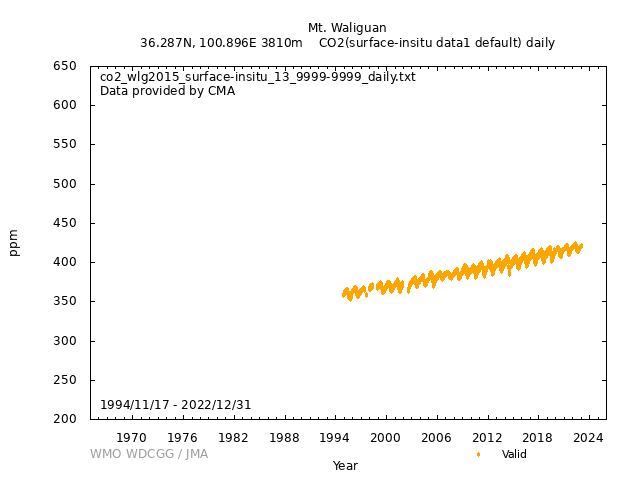
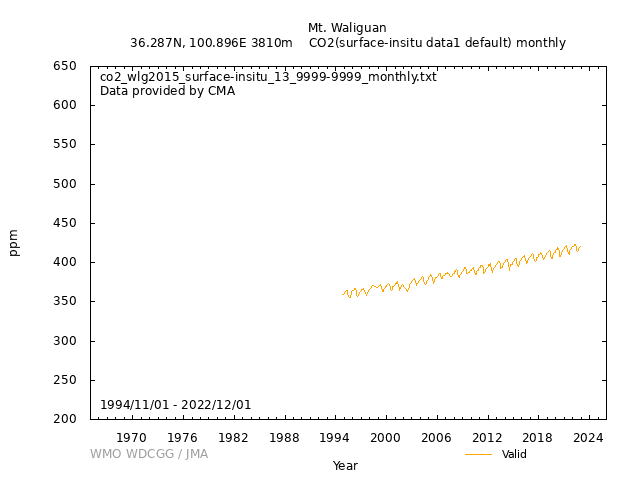
[Hourly] After computing the CO2 mole fractions, the valid data were manually inspected to eliminate the events which were influenced by analytical or sampling problems. Then the remainder of data were aggregated to hourly averages and were used for further processing. Licor6251 (NDIR): 1)Hourly averaged raw data was computed from without "flagged" minute data within one hour measurements. Missing hourly data value default as "99999.999". 2)Hourly averaged background data time series were selected using local surface wind direction and speed to distinguish samples of regionally representative air (background) from samples influenced by local sources and sinks (non-background). Using the statistic method, the acquired rate of the data which were categorized as background CO2 values ca 70%. Picarro G1301, G1302 & G2401 (CRDS): 1)The data from 2009 to 2016 were mainly from G1301. Some of the data gaps were synchronized and merged by the data from G1302. Since July 2016, the data were from G2401. 2)The data series was then filtered into "background" events considering with the meteorological conditions, data variations, etc. [Daily] The daily averages are based on only those hourly averages deemed to be "background" values. [Monthly] Monthly averages are computed from the daily averages. Missing daily averages are skipped. |
|
| Operational/Reporting | |
|
Wind direction: Wind speed: Relative humidity: Precipitation amount: Air pressure: Air temperature: Dew point temperature: Sea water temperature: Sea surface water temperature: Sea water salinity: Sea surface water salinity: |
|
|
Meteorological data may remain as first provided, even when greenhouse gas data are updated. |
No DOI available
Related information
GAW Data Policy
"For Scientific purposes, access to these data is unlimited and provided without charge.
By their use you accept that an offer of co-authorship will be made through personal contact with the data providers
or owners whenever substantial use is made of their data.
In all cases, an acknowledgement must be made to the data providers or owners and to the data centre when these data are used within a publication."
Citation format
This format is an example of the WDCGG standard citation.
Please follow the citation format which the data providers or owners indicate.
Please follow the citation format which the data providers or owners indicate.
LIANG Miao (CMA),
Atmospheric CO2
at Mt. Waliguan by China Meteorological Administration,
dataset published as CO2_WLG2015_surface-insitu_CMA_data1 at WDCGG,
ver. 2025-04-07-0857 (Reference date*: YYYY/MM/DD)
* As the reference date, please indicate the date you downloaded the files.
* As the reference date, please indicate the date you downloaded the files.
Reference(s)
| 1 | Zhang F., Zhou L. X., (2013). Implications for CO2 emissions and sinks changes in western China during 1995-2008 from atmospheric CO2 at Waliguan, Tellus B, 65, 19576. |
|---|---|
| 2 | S. X Fang, L. X. Zhou, P. P. Tans, et al., (2014). In-situ measurement of atmospheric CO2 at the four WMO/GAW stations in China. Atmospheric Chemistry and Physics, 14, 2541-2554. |
| 3 | S. X Fang, P. P. Tans, M. Steinbacher, et al. (2015), Study of the regional CO2 mole fractions filtering approach at a WMO/GAW regional station in China, Atmospheric Measurement Technique, 8, 5301-5313. |
| 4 | Zhang, F., Zhou, L. X., Conway T. J., et al (2013). Short-term variations of atmospheric CO2 and dominant causes in summer and winter: Analysis of 14-year continuous observational data at Waliguan, China, Atmospheric Environment, 77, 140-148. |


