Data Policy
GAW Data Policy
"For Scientific purposes, access to these data is unlimited and provided without charge.
By their use you accept that an offer of co-authorship will be made through personal contact with the data providers
or owners whenever substantial use is made of their data.
In all cases, an acknowledgement must be made to the data providers or owners and to the data centre when these data are used within a publication."
Version
2026-06-26-1315 (Last updated: 2026-07-17)File
This data set is submitted by AEMET.
In line with the GAW Data Policy, users should contact the contributors of all data of interest and propose co-authorship or acknowledgement.
Organization
| NO | 3 |
|---|---|
| Acronym | AEMET |
| Name | State Meteorological Agency of Spain |
| Address 1 | Izana Atmospheric Research Center |
| Address 2 | C/ La Marina, 20, Planta 6, 38001 Santa Cruz de Tenerife, Spain |
| Address 3 | |
| Country/Territory | Spain |
| Website | https://izana.aemet.es/ |
Contact(s)
| Name | Pedro Rivas |
|---|---|
| Prefix | Mr. |
| privass@aemet.es | |
| Organization No | 3 |
| Organization acronym | AEMET |
| Organization name | State Meteorological Agency of Spain |
| Organization country/territory | Spain |
| Address 1 | C/ La Marina, 20, Planta 6, 38001 Santa Cruz de Tenerife, Spain |
| Address 2 | |
| Address 3 | |
| Country/territory | Spain |
| Tel | +34-922-151718 |
| Fax | +34-922-574475 |
| Last updated date | 2026-08-27 |
| Name | Carlos Torres |
|---|---|
| Prefix | Mr. |
| ctorresg@aemet.es | |
| Organization No | 3 |
| Organization acronym | AEMET |
| Organization name | State Meteorological Agency of Spain |
| Organization country/territory | Spain |
| Address 1 | C/ La Marina, 20, Planta 6, 38001 Santa Cruz de Tenerife, Spain |
| Address 2 | |
| Address 3 | |
| Country/territory | Spain |
| Tel | +34-922-151718 |
| Fax | +34-922-574475 |
| Last updated date | 2026-06-26 |
| Background observation | |
| UTC | |
| ppm | |
|
9999-12-31 00:00:00 - 1994-12-31 23:59:59: WMO CO2 X1987 1995-01-01 00:00:00 - 2007-01-18 23:59:59: WMO CO2 X1993 2007-01-19 00:00:00 - 9999-12-31 23:59:59: WMO CO2 X2019 |
|
|
9999-12-31 00:00:00 - 2007-01-18 23:59:59: Ultramat 3, SIEMENS(NDIR) 2007-01-19 00:00:00 - 2013-11-30 23:59:59: Li-7000, LI-COR(NDIR) 2013-12-01 00:00:00 - 2014-05-15 23:59:59: Li-6252, LI-COR(NDIR) 2014-05-16 00:00:00 - 2018-12-31 23:59:59: Li-7000, LI-COR(NDIR) 2019-01-01 00:00:00 - 9999-12-31 23:59:59: Picarro G2401 #2352-CFKADS2196(CRDS) |
|
|
9999-12-31 00:00:00 - 1999-12-31 23:59:59: 13 (m) 2000-01-01 00:00:00 - 2005-05-31 23:59:59: 8 (m) 2005-06-01 00:00:00 - 9999-12-31 23:59:59: 29 (m) |
|
| 2 seconds | |
|
1984 - January 18, 2007: Instrument calibrations are performed using 3 working standards (during 6 minutes each one) every 3 hours (starting at 00:00 UTC every day). January 19, 2007 - December 31, 2018: Instrument calibrations are performed using 3 working standards (during 3 minutes each one) every hour (starting at 00:30 UTC every day). Our primary laboratory standards have been purchased from WMO GAW CO2 CCL. The working standards are calibrated periodically as follows. a) Before 2000, three levels of station standard gases were used (primary, secondary and working gases). The working gases were calibrated against the secondary gases every 2 weeks. The secondary tanks were calibrated against the station primary tanks every 3 or 4 months. B) After 2000, only two levels of station standard gases are used (primary and working gases). The working tanks are calibrated every 2 weeks against primary tanks. From 2019: A new CRDS analyzer is calibrated monthly using 4 primary standards to determine a quadratic calibration curve. |
|
|
Between calibrations, ambient air is analyzed continuously. Raw data are stored as: 30 minutes (before June 30, 1993) 10 minutes (from July 1993 to January 18, 2007) 30 seconds (from January 19, 2007) mean values and standard deviations. Physical data from the NDIR analyzers are obtained using the instrument calibrations performed using 3 working standards (see "Measurement calibration"). Several procedures are used to identify, manually or automatically, periods of contamination or malfunction of the instrumental system, and the associated measurements are discarded. |
|
|
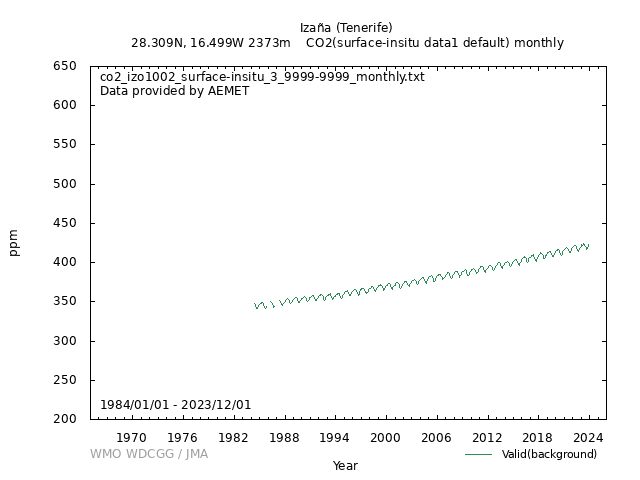
[Hourly] Hourly data are generated by arithmetic means from the 10 minutes means (30 minutes means before June 30, 1993) without including invalid data. SD: standard deviation of the sample (including the internal standard deviation of the 10 min means). ND (provided only for years greater than 2002): number of 10 minutes means used to compute the hourly mean. [Daily] The daily mean for the day "n" is computed averaging the corresponding available hourly means between 20:00 UTC of day "n-1" and 08:00 UTC of day "n" (so, they could be called "daily night means"). The atmospheric conditions at the station during the night correspond to background pure free troposphere. SD: standard deviation of the sample of hourly means. ND: number of hourly means available for computing the daily night mean (max=12). [Monthly] Monthly data are computed averaging the corresponding daily night means. SD: standard deviation of the sample of daily night means. ND: number of valid daily night means used. |
|
| Operational/Reporting | |
|
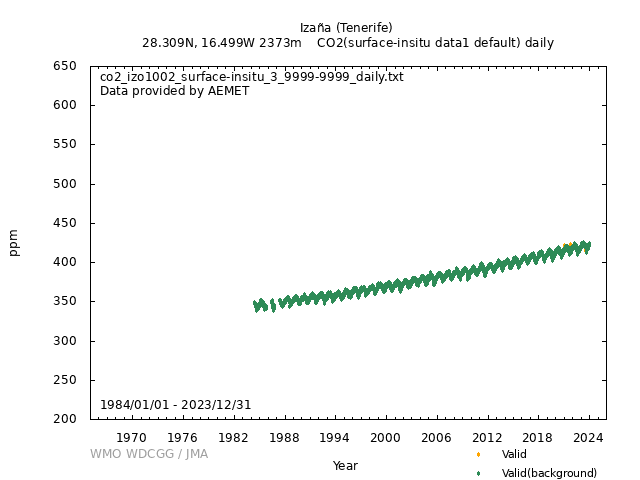
Scientific Aim : To determine temporal variability of atmospheric CO2 at Izaña (North Atlantic free troposphere background conditions): short-term variability, seasonal variability and long-term trend. To provide data to WDCGG as a Global GAW station. The Izaña station is located at 2372.90 m above see level, on the Island of Tenerife, Spain. The ground in the vicinity around Izaña is loosely covered with light volcanic soil. The vegetation in the surrounding area is sparse, consisting mainly of broom. A belt of pine forest grows between 1000 and 2000 meters a.s.l. During nighttime (20UTC-08UTC), in situ measurements are representative of free troposphere background conditions. This is due to the following facts: a) usually a strong subtropical temperature inversion layer is located at a lower altitude than Izana station; b) Izana station is located on the top of a crest, so during the night period downslope wind produces (by mass conservation) the arrival of free troposphere air to Izana. During daytime, small amounts of air coming from the forest can arrive to the station (due to surface upslope wind produced by ground diurnal heating) producing a decrease of 1 to 2.5 ppm in CO2 mixing ratio during noon and afternoon. Apart from this effect, there is no arrival of polluted air from the rest of the island, due to the presence of the strong subtropical temperature inversion layer. The general ambient air inlet, which provides ambient air for all instruments that analyze it, is an 8cm inner diameter (ID) stainless steel pipe and has a high flow rate. This inlet is situated on top of the building tower; the height above the ground has changed through the years: 13 m (1984-2000), 8 m (2000- May 2005) and 29 m (from June 2005). Upstream of the instrument, a cryocool trap is used to reduce the dew point of ambient air to -70 ºC (before June 2005, also standard gases were flowed through the cryocool trap). |
|
|
Wind direction: 1 Wind speed: 1 Relative humidity: 1 Precipitation amount: 0 Air pressure: 0 Air temperature: 1 Dew point temperature: 0 Sea water temperature: 0 Sea surface water temperature: 0 Sea water salinity: 0 Sea surface water salinity: 0 |
|
|
Meteorological data may remain as first provided, even when greenhouse gas data are updated. |
No DOI available
Related information
GAW Data Policy
"For Scientific purposes, access to these data is unlimited and provided without charge.
By their use you accept that an offer of co-authorship will be made through personal contact with the data providers
or owners whenever substantial use is made of their data.
In all cases, an acknowledgement must be made to the data providers or owners and to the data centre when these data are used within a publication."
Citation format
This format is an example of the WDCGG standard citation.
Please follow the citation format which the data providers or owners indicate.
Please follow the citation format which the data providers or owners indicate.
Pedro Rivas (AEMET),
Carlos Torres (AEMET),
Atmospheric CO2
at Izaña (Tenerife) by State Meteorological Agency of Spain,
dataset published as CO2_IZO1002_surface-insitu_AEMET_data1 at WDCGG,
ver. 2026-06-26-1315 (Reference date*: YYYY/MM/DD)
* As the reference date, please indicate the date you downloaded the files.
* As the reference date, please indicate the date you downloaded the files.
Reference(s)
| 1 | Gomez-Pelaez, A.J., Ramos, R., Perez-delaPuerta, J., "Methane and carbon dioxide continuous measurements at Izana GAW station (Spain)" in GAW Report (No. 168) of the "13th WMO/IAEA Meeting of Experts on Carbon Dioxide Concentration and Related Tracers Measurement Techniques (Boulder, Colorado, USA, 19-22 September 2005)", edited by J.B. Miller, World Meteorological Organization (TD No. 1359), 180-184, 2006 |
|---|---|
| 2 | Gomez-Pelaez, A.J., Ramos, R., "Improvements in the Carbon Dioxide and Methane Continuous Measurement Programs at Izaña Global GAW Station (Spain) during 2007-2009", in GAW report (No. 194) of the "15th WMO/IAEA Meeting of Experts on Carbon Dioxide, Other Greenhouse Gases, and Related Tracer Measurement Techniques (Jena, Germany; September 7-10, 2009)", edited by Willi A. Brand, World Meteorological Organization (TD No. 1553), 133-138, 2011 |
| 3 | Gomez-Pelaez, A.J., R. Ramos, V. Gomez-Trueba, R. Campo-Hernandez, E. Reyes-Sanchez: "Izaña Global GAW station greenhouse-gas measurement programme. Novelties and developments during October 2011-May 2013" in GAW report (No. 213) of the "17th WMO/IAEA Meeting on Carbon Dioxide, Other Greenhouse Gases, and Related Measurement Techniques (Beijing, China, June 10-14, 2013)", edited by P. Tans and C. Zellweger, World Meteorological Organization, 77-82, 2014 |
| 4 | Gomez-Pelaez, A.J., R. Ramos, V. Gomez-Trueba, R. Campo-Hernandez, E. Reyes-Sanchez: "GGMT-2015 Izaña station update: instrumental and processing software developments, scale updates, aircraft campaign, and plumbing design for CRDS" in GAW report (No. 229) of the "18th WMO/IAEA Meeting on Carbon Dioxide, Other Greenhouse Gases, and Related Measurement Techniques (GGMT) (La Jolla, CA, USA, 13-17 September, 2015)", edited by P. Tans and C. Zellweger, World Meteorological Organization, 125-131, 2016 |
| 5 | Gomez-Pelaez, A. J., Ramos, R., Cuevas, E., Gomez-Trueba, V., and Reyes, E.: Atmospheric CO2, CH4, and CO with the CRDS technique at the Izaña Global GAW station: instrumental tests, developments, and first measurement results, Atmos. Meas. Tech., 12, 2043–2066, https://doi.org/10.5194/amt-12-2043-2019, 2019. |
| 6 | Zellweger, C., M. Steinbacher, B. Buchmann, R. Steinbrecher (2015), System and Performance Audit of Surface Ozone, Methane, Carbon Dioxide, Nitrous Oxide and Carbon Monoxide at the Global GAW Station Izaña, September 2013. WCC-Empa Report 13/2 |
| 7 | Zellweger, C., M. Steinbacher, B. Buchmann, R. Steinbrecher (2020), System and Performance Audit of Surface Ozone, Carbon Monoxide, Methane, Carbon Dioxide and Nitrous Oxide at the Global GAW Station Izaña, Spain, May 2019. WCC-Empa Report No. 19/2 |
| 8 | Zellweger, C., M. Steinbacher, L. Emmenegger (2023), System and performance audit of Surface Ozone, Carbon Monoxide, Methane, Carbon Dioxide and Nitrous Oxide at the Global GAW Station Iza ña, Spain, June 2023. WCC-Empa Report 23/1 |