Data Policy
GAW Data Policy
"For Scientific purposes, access to these data is unlimited and provided without charge.
By their use you accept that an offer of co-authorship will be made through personal contact with the data providers
or owners whenever substantial use is made of their data.
In all cases, an acknowledgement must be made to the data providers or owners and to the data centre when these data are used within a publication."
Version
2026-08-12-1045 (Last updated: 2026-08-26)File
This data set is submitted by NOAA.
In line with the GAW Data Policy, users should contact the contributors of all data of interest and propose co-authorship or acknowledgement.
Organization
| NO | 2 |
|---|---|
| Acronym | NOAA |
| Name | Global Monitoring Laboratory, NOAA |
| Address 1 | NOAA/ESRL |
| Address 2 | R/GML1 |
| Address 3 | 325 Broadway Boulder, CO 80305-3328 |
| Country/Territory | United States of America |
| Website | https://gml.noaa.gov/ |
Contact(s)
| Name | Gabrielle Petron |
|---|---|
| Prefix | |
| Gabrielle.Petron@noaa.gov | |
| Organization No | 2 |
| Organization acronym | NOAA |
| Organization name | Global Monitoring Laboratory, NOAA |
| Organization country/territory | United States of America |
| Address 1 | NOAA GML |
| Address 2 | 325 Broadway R/GML-1 |
| Address 3 | Boulder, CO 80305-3328 |
| Country/territory | United States of America |
| Tel | (720) 295-0145 |
| Fax | |
| Last updated date | 2026-08-18 |
| Name | Philip Handley |
|---|---|
| Prefix | |
| philip.handley@noaa.gov | |
| Organization No | 2 |
| Organization acronym | NOAA |
| Organization name | Global Monitoring Laboratory, NOAA |
| Organization country/territory | United States of America |
| Address 1 | NOAA GML |
| Address 2 | 325 Broadway R/GML-1 |
| Address 3 | Boulder, CO 80305-3328 |
| Country/territory | United States of America |
| Tel | |
| Fax | |
| Last updated date | 2026-08-12 |
| Background observation | |
| UTC | |
| ppm | |
|
9999-12-31 00:00:00 - 9999-12-31 23:59:59: WMO CO2 X2019 |
|
|
9999-12-31 00:00:00 - 9999-12-31 23:59:59: Unknown(NDIR) |
|
| Unknown | |
|
NDIR systems were first calibrated with two reference gases each hour, then with three reference gases each hour starting in 1998. A linear or quadratic response of the analyzer was determined from these reference gases, and the mole fraction of the ambient air sample was determined from this response. For the SPO NDIR starting in January 2018, the analyzer response was calibrated with a suite of 4 standards twice a day relative to a reference gas. The reference gas is measured twice an hour to track and correct short-term analyzer drift. For the BRW ICOS (January 2017-April 2025) and MLO CRDS (June 2019-2026) systems, the analyzer response is calibrated with a suite of standards every two weeks relative to a reference gas (sometimes less often at MLO following the November 2022 eruption), and the reference gas is measured hourly to track and correct short-term analyzer drift. For the CRDS systems installed at BRW and SMO in 2025, analyzer responses are calibrated using a suite of 4 standards every 37 hours and 24 hours , respectively. Additionally, a reference gas is measured every four hours and two hours respectively to account for short-term drift. As a quality assurance procedure, a "target" gas, that is a cylinder with well-known composition, treated as an unknown, is measured up to twice per day at all four observatories. NOAA carbon dioxide measurements are reported on the WMO X2019 CO2 standard scale. (https://gml.noaa.gov/ccl/co2_scale.html; Hall et al., 2021). The in-situ CO2 records from the four baseline observatories were reprocessed from raw data using updated X2019 values for working standards used on the observatory systems. The working standards used on the observatory in-situ systems during the 1970s through early 1980s were value assigned by SIO, not by measurements at NOAA. These standards remain assigned on an SIO scale. Start dates for the transition to the X2019 scale for each observatory are: BRW: X2019 starts at 1980-03-19.2100 MLO: X2019 starts at 1982-04-28.2000 SMO: X2019 starts at 1982-05-15.2300 SPO: X2019 starts at 1981-02-11.0400 |
|
| Measurement uncertainty (value_unc_1) was added to CO2 hourly averages for all sites for 2019, for BRW and SPO for 2018, and for BRW for 2017. The uncertainty is based on analytical repeatability and reproducibility, and our ability to propagate the WMO CO2 mole fraction standard scale to our measurements. Repeatability is based on the stability of reference gas measurements, and reproducibility is based on long term measurements of a known 'target' gas. The scale propagation term is based on the uncertainty we assign to standards, 0.03 ppm. All terms are given as 68% confidence intervals. Although we still list "value_sd" of hourly averages (standard deviation of values that go into an hourly average as described above, which includes natural variability and measurement uncertainty), we now list measurement uncertainty as a separate term. Total uncertainty is calculated by adding the individual terms in quadrature (square root of the sum of the squares). | |
|
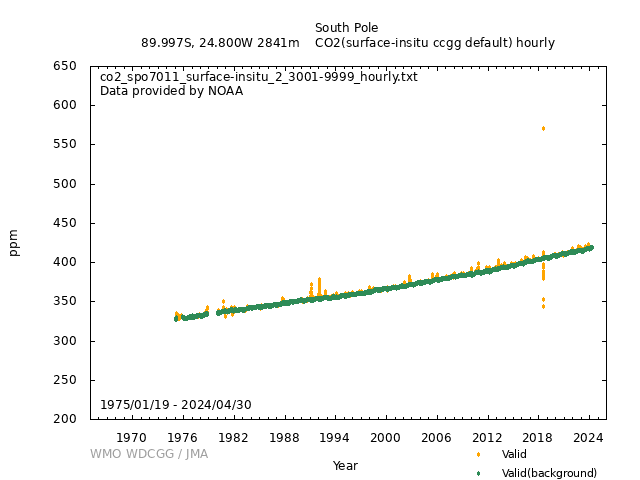
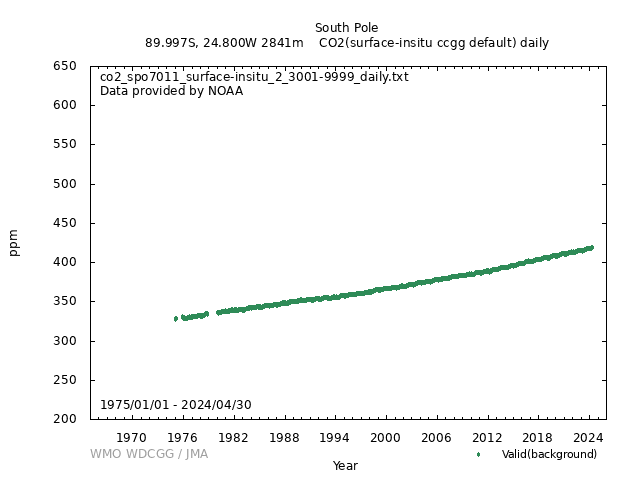
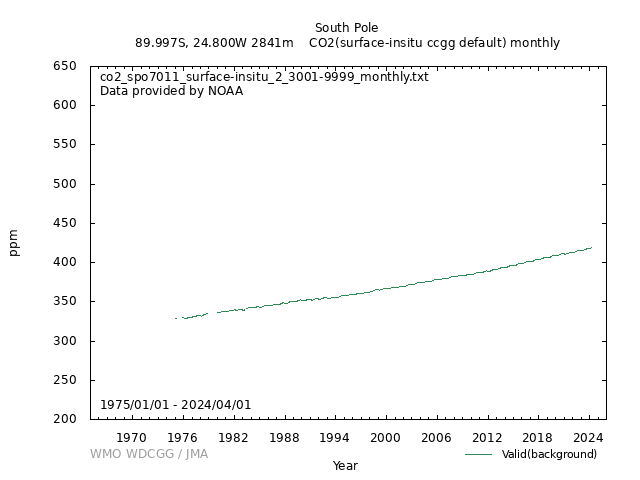
[Hourly] Starting in about 1986 (depending on site), minute average or 10 second average values of the analyzer output are recorded, and an hourly average and standard deviation of the ambient mole fraction CO2 is calculated (prior to about 1986, the standard deviation was not available). The value_sd takes into account the analyzer standard deviation, so normally it is not 0 even if nvalue=1. A value_sd value of 0.0 or -999.999 indicates times when the analyzer output standard deviation for the hour is unavailable. For spectrometer systems and for the SPO NDIR system starting in January 2018, 5-minute averages are used to calculate hourly averages, but value_sd includes variability in the 5-min averages, so it is greater than the normal sample SD of the 5-min averages that go into the hourly mean, and when nvalue=1 (i.e., one 5-min average in the hourly mean), value_sd is still calculated and reported. [Daily] Daily values derived from hourly data representative of baseline conditions [Monthly] Monthly values derived from hourly data representative of baseline conditions |
|
| This is the NOAA 3-character quality control flag. Column 1 is the REJECTION flag. An alphanumeric other than a period (.) in the FIRST column indicates a sample with obvious problems during collection or analysis. This measurement should not be interpreted. Column 2 is the SELECTION flag. An alphanumeric other than a period (.) in the SECOND column indicates a sample that is likely valid but does not meet selection criteria determined by the goals of a particular investigation. Column 3 is the INFORMATION flag. An alphanumeric other than a period (.) in the THIRD column provides additional information about the collection or analysis of the sample. | |
|
Valid (background): ... Valid (background): ..? Valid: .?? Invalid: ??? |
|
| Operational/Reporting | |
|
Atmospheric Carbon Dioxide Dry Air Mole Fractions from quasi-continuous measurements at South Pole. These data are provided by NOAA. Principal investigators include Gabrielle Petron (NOAA) AND Philip Handley (NOAA). Please cite the product's citation when using data from this dataset : G. Pétron, P. Handley, J. Hakala, J. Kofler, K. W. Thoning, A. Crotwell, A. Clarke, J. Fernandez, I. Crocker, R. Burgener, B. Thomas, A. Colton, S. Jordan, L. Longren, M. Doneghey, M. Trudeau, T. Mefford, S. DeVogel, A. Searle, X. Lan, J. Mauss, C. Smith, B. Vasel, S. Morris, J. Miller and J. Mund (2026), Atmospheric Carbon Dioxide Dry Air Mole Fractions from continuous measurements at Mauna Loa, Hawaii, Utqiaġvik, Alaska, American Samoa and South Pole, 1973-present. Version 2026-08-11, National Oceanic and Atmospheric Administration (NOAA), Global Monitoring Laboratory (GML), Boulder, Colorado, USA https://doi.org/10.15138/yaf1-bk21 |
|
|
Wind direction: Wind speed: Relative humidity: Precipitation amount: Air pressure: Air temperature: Dew point temperature: Sea water temperature: Sea surface water temperature: Sea water salinity: Sea surface water salinity: |
|
|
Meteorological data may remain as first provided, even when greenhouse gas data are updated. |
DOI Metadata
| DOI |
|
||||||||||||
|---|---|---|---|---|---|---|---|---|---|---|---|---|---|
| For more information, please refer: doi.org/10.15138/yaf1-bk21 | |||||||||||||
Related information
GAW Data Policy
"For Scientific purposes, access to these data is unlimited and provided without charge.
By their use you accept that an offer of co-authorship will be made through personal contact with the data providers
or owners whenever substantial use is made of their data.
In all cases, an acknowledgement must be made to the data providers or owners and to the data centre when these data are used within a publication."
Citation format
This format is an example of the WDCGG standard citation.
Please follow the citation format which the data providers or owners indicate.
Please follow the citation format which the data providers or owners indicate.
Gabrielle Petron (NOAA),
Philip Handley (NOAA),
Atmospheric CO2
at South Pole by Global Monitoring Laboratory, NOAA,
dataset published as CO2_SPO7011_surface-insitu_NOAA_ccgg at WDCGG,
ver. 2026-08-12-1045 (Reference date*: YYYY/MM/DD)
* As the reference date, please indicate the date you downloaded the files.
* As the reference date, please indicate the date you downloaded the files.
Reference(s)
| 1 | G. Pétron, P. Handley, J. Hakala, J. Kofler, K. W. Thoning, A. Crotwell, A. Clarke, J. Fernandez, I. Crocker, R. Burgener, B. Thomas, A. Colton, S. Jordan, L. Longren, M. Doneghey, M. Trudeau, T. Mefford, S. DeVogel, A. Searle, X. Lan, J. Mauss, C. Smith, B. Vasel, S. Morris, J. Miller and J. Mund (2026), Atmospheric Carbon Dioxide Dry Air Mole Fractions from continuous measurements at Mauna Loa, Hawaii, Utqiaġvik, Alaska, American Samoa and South Pole, 1973-present. Version 2026-08-11, National Oceanic and Atmospheric Administration (NOAA), Global Monitoring Laboratory (GML), Boulder, Colorado, USA https://doi.org/10.15138/yaf1-bk21 |
|---|---|
| 2 | Gillette, D.A., W.D. Komhyr, L.S. Waterman, L.P. Steele, and R.H. Gammon, The NOAA/GMCC continuous CO2 record at the South Pole, 1975 1982, J. Geophys. Res., 92, 4231 4240, 1987. |
| 3 | Conway, T. J. and K. W. Thoning (1990), Short-term variations of atmospheric carbon dioxide at the South Pole, Antarctic Journal of the United States, 236-238. |