Data Policy
GAW Data Policy
"For Scientific purposes, access to these data is unlimited and provided without charge.
By their use you accept that an offer of co-authorship will be made through personal contact with the data providers
or owners whenever substantial use is made of their data.
In all cases, an acknowledgement must be made to the data providers or owners and to the data centre when these data are used within a publication."
Version
2025-01-01-0002 (Last updated: 2024-12-25)File
This data set is submitted by NOAA.
In line with the GAW Data Policy, users should contact the contributors of all data of interest and propose co-authorship or acknowledgement.
Organization
| NO | 2 |
|---|---|
| Acronym | NOAA |
| Name | Global Monitoring Laboratory, NOAA |
| Address 1 | NOAA/ESRL |
| Address 2 | R/GML1 |
| Address 3 | 325 Broadway Boulder, CO 80305-3328 |
| Country/Territory | United States of America |
| Website | https://gml.noaa.gov/ |
Contact(s)
| Name | Gabrielle Petron |
|---|---|
| Prefix | |
| Gabrielle.Petron@noaa.gov | |
| Organization No | 2 |
| Organization acronym | NOAA |
| Organization name | Global Monitoring Laboratory, NOAA |
| Organization country/territory | United States of America |
| Address 1 | NOAA GML |
| Address 2 | 325 Broadway R/GML-1 |
| Address 3 | Boulder, CO 80305-3328 |
| Country/territory | United States of America |
| Tel | (720) 295-0145 |
| Fax | |
| Last updated date | 2024-08-13 |
|
|||||||||||||||||||||||||||
| Background observation | |||||||||||||||||||||||||||
| UTC | |||||||||||||||||||||||||||
| ppb | |||||||||||||||||||||||||||
|
9999-12-31 00:00:00 - 9999-12-31 23:59:59: WMO H2 X2009 (MPI-2009) |
|||||||||||||||||||||||||||
|
9999-12-31 00:00:00 - 9999-12-31 23:59:59: Unknown(Gas chromatography (PDD)) |
|||||||||||||||||||||||||||
| weekly | |||||||||||||||||||||||||||
|
All air samples were analyzed for H2 at the NOAA GML laboratory in Boulder using gas chromatography with a Helium Pulse Discharge Detector (Novelli et al., 2009). All measurements are referenced to the WMO/MPI X2009 calibration scale. Between 2009 and July 2019, we used a single standard calibration strategy as the response characteristics of the instrument, Gas Chromatography with a Pulsed Discharged Helium Ionization Detector, has been shown to be linear over a range of 0 to 2000 ppb H2 (Novelli et al., 2009). Since August 2019, we use a multi-standard calibration strategy (normalized to a reference air tank) for the flask analysis system instrument, MAGICC-3. These calibration episodes were conducted biweekly early on and are now performed every 4 to 5 weeks. Instrument drift between calibration episodes is corrected by normalization to a reference tank. The calibration response results for the H2 standards normalized peak heights are valid until the next calibration episode. |
|||||||||||||||||||||||||||
| One sigma total uncertainties are provided. They are calculated from two terms: short term repeatability and calibration scale propagation uncertainty. To get the total uncertainty variance, terms are added in quadrature. | |||||||||||||||||||||||||||
|
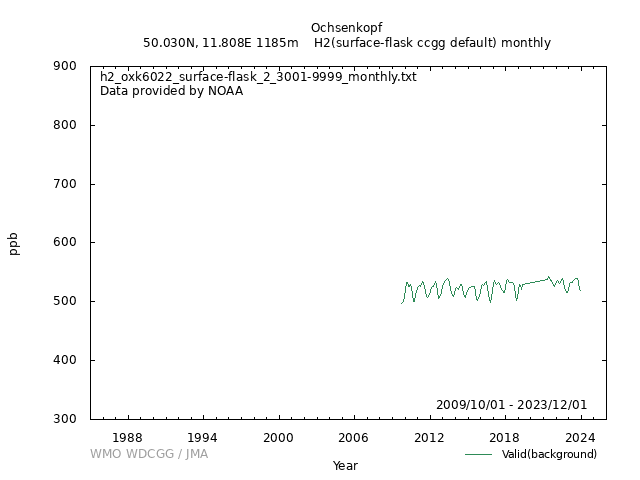
[Hourly] [Daily] [Monthly] Monthly means are produced for each site by first averaging all valid measurement results in the event file with a unique sample date and time. Values are then extracted at weekly intervals from a smooth curve (Thoning et al., 1989) fitted to the averaged data and these weekly values are averaged for each month to give the monthly means recorded in the files. Flagged data are excluded from the curve fitting process. Some sites are excluded from the monthly mean directory because sparse data or a short record does not allow a reasonable curve fit. Also, if there are 3 or more consecutive months without data, monthly means are not calculated for these months. |
|||||||||||||||||||||||||||
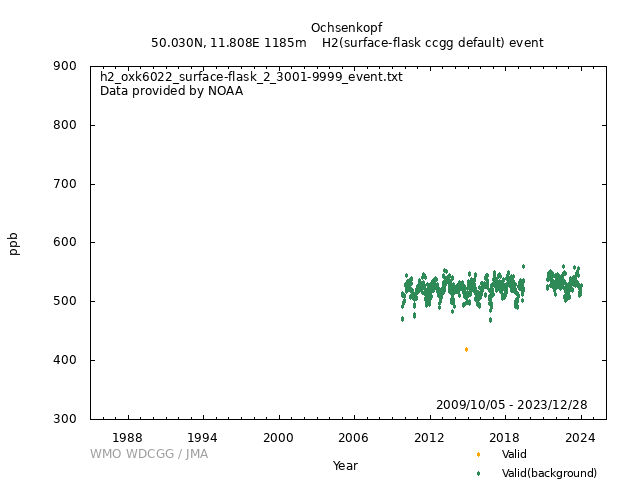
| This is the NOAA 3-character quality control flag. Column 1 is the REJECTION flag. An alphanumeric other than a period (.) in the FIRST column indicates a sample with obvious problems during collection or analysis. This measurement should not be interpreted. Column 2 is the SELECTION flag. An alphanumeric other than a period (.) in the SECOND column indicates a sample that is likely valid but does not meet selection criteria determined by the goals of a particular investigation. For example, it might not have been obtained during 'background' conditions. Column 3 is the INFORMATION flag. An alphanumeric other than a period (.) in the THIRD column provides additional information about the collection or analysis of the sample. A P in the 3rd column of the QC flag indicates the measurement result is preliminary and has not yet been carefully examined by the PI. The P flag is removed once the quality of the measurement has been determined. | |||||||||||||||||||||||||||
|
Valid (background): ... Valid (background): ..? Valid: .?? Invalid: ??? |
|||||||||||||||||||||||||||
| Operational/Reporting | |||||||||||||||||||||||||||
|
Atmospheric Hydrogen Dry Air Mole Fractions from the NOAA GML Carbon Cycle Cooperative Global Air Sampling Network, starting in 2009 These data are provided by NOAA. Principal investigators include Gabrielle Petron (NOAA). Key partners include Jost Lavric (MPI-BGC) AND Max Planck Institute for Biogeochemistry (MPI-BGC). Please cite the product's citation when using data from this dataset : Petron, G., Crotwell, A.M., Madronich, M., Moglia, E., Baugh, K.E., Kitzis, D., Mefford, T., DeVogel, S., Neff, D., Lan, X., Crotwell, M.J., Thoning, K., Wolter, S., Mund, J.W., (2024), Atmospheric Hydrogen Dry Air Mole Fractions from the NOAA GML Carbon Cycle Cooperative Global Air Sampling Network, 2009-2023, Version: 2024-07-30, https://doi.org/10.15138/WP0W-EZ08 |
|||||||||||||||||||||||||||
|
Wind direction: Wind speed: Relative humidity: Precipitation amount: Air pressure: Air temperature: Dew point temperature: Sea water temperature: Sea surface water temperature: Sea water salinity: Sea surface water salinity: |
|||||||||||||||||||||||||||
|
Meteorological data may remain as first provided, even when greenhouse gas data are updated. |
DOI Metadata
| DOI |
|
||||||||
|---|---|---|---|---|---|---|---|---|---|
| For more information, please refer: doi.org/10.15138/WP0W-EZ08 | |||||||||
Related information
| Format | Text (WDCGG Data Format Table, WDCGG Meteorological Data Format Table), NetCDF | ||||
|---|---|---|---|---|---|
| Relation List (Is Part Of) |
All H2 data contributed to WDCGG by GAW stations and mobiles by 2025-08-29 All H2 data contributed to WDCGG by GAW stations and mobiles by 2024-08-30 All H2 data contributed to WDCGG by GAW stations and mobiles by 2023-09-04 |
||||
| Geolocation Point |
|
GAW Data Policy
"For Scientific purposes, access to these data is unlimited and provided without charge.
By their use you accept that an offer of co-authorship will be made through personal contact with the data providers
or owners whenever substantial use is made of their data.
In all cases, an acknowledgement must be made to the data providers or owners and to the data centre when these data are used within a publication."
Citation format
This format is an example of the WDCGG standard citation.
Please follow the citation format which the data providers or owners indicate.
Please follow the citation format which the data providers or owners indicate.
Gabrielle Petron (NOAA),
Atmospheric H2
at Ochsenkopf by Global Monitoring Laboratory, NOAA,
dataset published as H2_OXK6022_surface-flask_NOAA_ccgg at WDCGG,
ver. 2025-01-01-0002 (Reference date*: YYYY/MM/DD)
* As the reference date, please indicate the date you downloaded the files.
* As the reference date, please indicate the date you downloaded the files.
Reference(s)
| 1 | Petron, G., Crotwell, A.M., Madronich, M., Moglia, E., Baugh, K.E., Kitzis, D., Mefford, T., DeVogel, S., Neff, D., Lan, X., Crotwell, M.J., Thoning, K., Wolter, S., Mund, J.W., (2024), Atmospheric Hydrogen Dry Air Mole Fractions from the NOAA GML Carbon Cycle Cooperative Global Air Sampling Network, 2009-2023, Version: 2024-07-30, https://doi.org/10.15138/WP0W-EZ08 |
|---|---|
| 2 | Novelli, P.C., K.A. Masarie, and P.M. Lang, Molecular hydrogen in the troposhere: Global distributions and budget, J. Geophys Res., 104, 30,427-30,444, 1999. |
| 3 | Novelli, P.C., Crotwell, A.M., and Hall, B.D, Application of Gas Chromatography with a Pulsed Discharge Helium Ionization Detector for Measurements of Molecular Hydrogen in the Atmosphere, Environ. Sci. Technol. 2009, 43, 2431-2436. |


