Data Policy
GAW Data Policy
"For Scientific purposes, access to these data is unlimited and provided without charge.
By their use you accept that an offer of co-authorship will be made through personal contact with the data providers
or owners whenever substantial use is made of their data.
In all cases, an acknowledgement must be made to the data providers or owners and to the data centre when these data are used within a publication."
Version
2025-08-21-1300 (Last updated: 2025-08-29)File
This data set is submitted by NOAA.
In line with the GAW Data Policy, users should contact the contributors of all data of interest and propose co-authorship or acknowledgement.
Organization
| NO | 2 |
|---|---|
| Acronym | NOAA |
| Name | Global Monitoring Laboratory, NOAA |
| Address 1 | NOAA/ESRL |
| Address 2 | R/GML1 |
| Address 3 | 325 Broadway Boulder, CO 80305-3328 |
| Country/Territory | United States of America |
| Website | https://gml.noaa.gov/ |
Contact(s)
| Name | Xin Lan |
|---|---|
| Prefix | |
| xin.lan@noaa.gov | |
| Organization No | 2 |
| Organization acronym | NOAA |
| Organization name | Global Monitoring Laboratory, NOAA |
| Organization country/territory | United States of America |
| Address 1 | NOAA GML |
| Address 2 | 325 Broadway R/GML-1 |
| Address 3 | Boulder, CO 80305-3328 |
| Country/territory | United States of America |
| Tel | |
| Fax | |
| Last updated date | 2025-08-18 |
| Background observation | |
| UTC | |
| ppm | |
|
9999-12-31 00:00:00 - 9999-12-31 23:59:59: WMO CO2 X2019 |
|
|
1976-01-01 00:00:00 - 2024-12-31 23:00:00: Unknown(NDIR) |
|
| Unknown | |
|
NDIR systems were first calibrated with two reference gases each hour, then with three reference gases each hour starting in 1998. A linear or quadratic response of the analyzer was determined from these reference gases, and the mole fraction of the ambient air sample was determined from this response. For laser-based spectrometers, the analyzer response is calibrated with a suite of standards every two weeks relative to a reference gas, and the reference gas is measured hourly to track and correct short term analyzer drift. As a quality assurance step, a well-calibrated "target" gas is measured up to twice per day. For the SPO NDIR starting in January 2018, the analyzer response is calibrated with a suite of 4 standards twice a day relative to a reference gas. The reference gas is measured twice an hour to track and correct short term analyzer drift. NOAA carbon dioxide measurements are reported on the WMO X2019 CO2 standard scale. (https://gml.noaa.gov/ccl/co2_scale.html). CO2 measurements from flask-air samples were recalculated onto the X2019 CO2 mole fraction scale by first reassigning all standards used on the CO2 analysis sytems to X2019. CO2 values on X2019 from air samples were caluclated by reprocessing the original raw files (i.e., files with raw analyzer output (typically voltages)) with the updated assignments for the standards. A detailed description of the scale revision from X2007 to X2019 is given in Hall et al. (2020), but the main reasons were to correct biases caused by CO2 absorption by O-rings in the manometric calibration system and to correct a virial coefficient used in the calculation. The magnitiude of the differences between X2019 and X2007 varies with CO2 abundance, and is typically between 0.1 and 0.2 ppm. Some differences from the late-2000s and early-2010s are larger (up to ~0.3 ppm) because of a mis-assigned standard on the system used to transfer the scale to working standards. Measurements prior to ~1980 from early analytical systems (instrument codes LR1 and LR2) could not be reprocessed onto X2019; they remain on a CO2 scale originally developed at Scripps Institution of Oceanography. |
|
| Measurement uncertainty (value_unc_1) was added to CO2 hourly averages for all sites for 2019, for BRW and SPO for 2018, and for BRW for 2017. The uncertainty is based on analytical repeatability and reproducibility, and our ability to propagate the WMO CO2 mole fraction standard scale. Repeatability is based on the stability of reference gas measurements, and reproducibility is based on long term measurements of a known 'target' gas. The scale propagation term is based on the uncertainty we assign to standards, 0.03 ppm. All terms are given as 68% confidence intervals. Although we still list "value_sd" of hourly averages (standard deviation of values that go into an hourly average as described above, which includes natural variability and measurement uncertainty), we now list measurement uncertainty as a separate term. Total uncertainty is calculated by adding the individual terms in quadrature (square root of the sum of the squares). | |
|
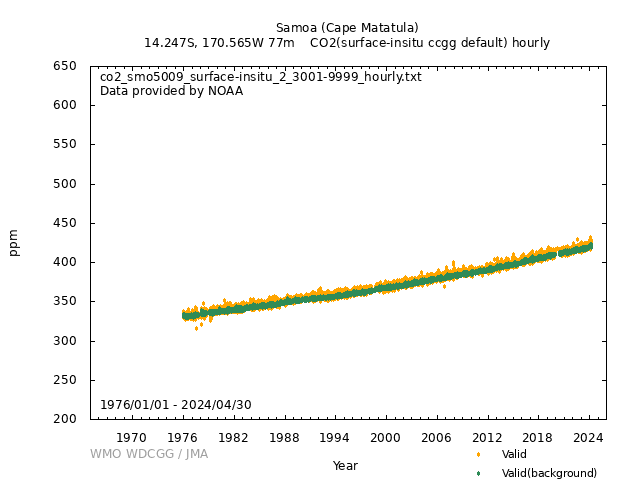
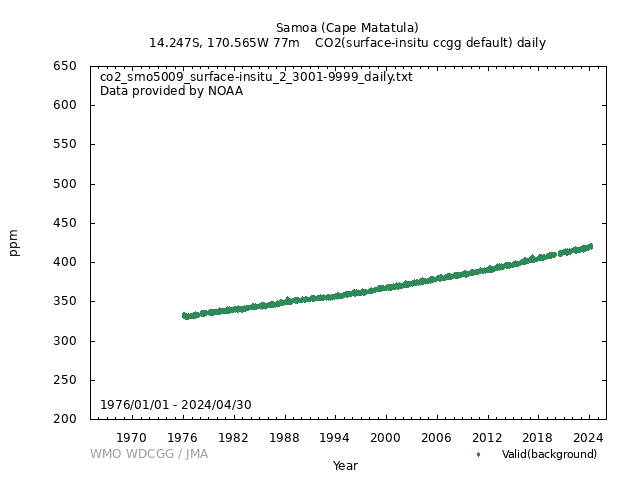
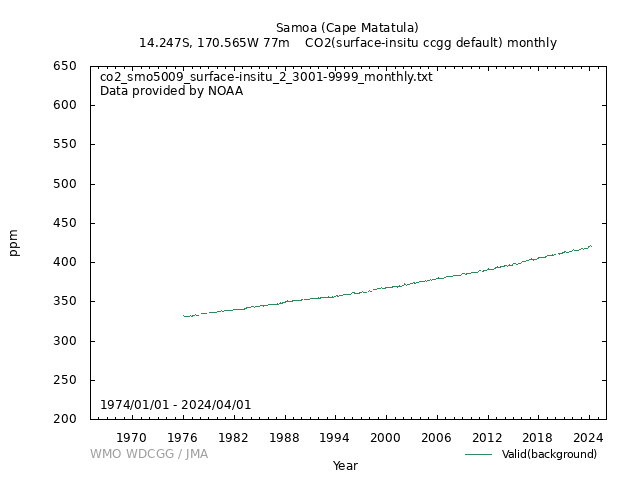
[Hourly] Starting in about 1986 (depending on site), minute average or 10 second average values of the analyzer output are recorded, and an hourly average and standard deviation of the ambient mole fraction CO2 is calculated (prior to about 1986, the standard deviation was not available). The value_sd takes into account the analyzer standard deviation, so normally it is not 0 even if nvalue=1. A value_sd value of 0.0 or -999.999 would indicate times when the analyzer output standard deviation for the hour is not available. For spectrometer systems and for the SPO NDIR system starting in January 2018, 5-minute averages are used to calculate hourly averages, but value_sd includes variability in the 5-min averages, so it is greater than the normal sample SD of the 5-min averages that go into the hourly mean, and when nvalue=1 (i.e., one 5-min average in the hourly mean), value_sd is still calculated and reported. [Daily] Daily values derived from hourly data representative of baseline conditions [Monthly] Monthly values derived from hourly data representative of baseline conditions |
|
| This is the NOAA 3-character quality control flag. Column 1 is the REJECTION flag. An alphanumeric other than a period (.) in the FIRST column indicates a sample with obvious problems during collection or analysis. This measurement should not be interpreted. Column 2 is the SELECTION flag. An alphanumeric other than a period (.) in the SECOND column indicates a sample that is likely valid but does not meet selection criteria determined by the goals of a particular investigation. Column 3 is the INFORMATION flag. An alphanumeric other than a period (.) in the THIRD column provides additional information about the collection or analysis of the sample. | |
|
Valid (background): ... Valid (background): ..? Valid: .?? Invalid: ??? |
|
| Operational/Reporting | |
|
Atmospheric Carbon Dioxide Dry Air Mole Fractions from quasi-continuous measurements at American Samoa. These data are provided by NOAA. Principal investigators include Kirk Thoning (NOAA) AND Xin Lan (NOAA). Please cite the product's citation when using data from this dataset : K.W. Thoning, A.M. Crotwell, and J.W. Mund (2025), Atmospheric Carbon Dioxide Dry Air Mole Fractions from continuous measurements at Mauna Loa, Hawaii, Barrow, Alaska, American Samoa and South Pole, 1973-present. Version 2025-04-26, National Oceanic and Atmospheric Administration (NOAA), Global Monitoring Laboratory (GML), Boulder, Colorado, USA https://doi.org/10.15138/yaf1-bk21 |
|
|
Wind direction: Wind speed: Relative humidity: Precipitation amount: Air pressure: Air temperature: Dew point temperature: Sea water temperature: Sea surface water temperature: Sea water salinity: Sea surface water salinity: |
|
|
Meteorological data may remain as first provided, even when greenhouse gas data are updated. |
DOI Metadata
| DOI |
|
||||||||||||
|---|---|---|---|---|---|---|---|---|---|---|---|---|---|
| For more information, please refer: doi.org/10.15138/yaf1-bk21 | |||||||||||||
Related information
| Format | Text (WDCGG Data Format Table, WDCGG Meteorological Data Format Table), NetCDF | ||||
|---|---|---|---|---|---|
| Relation List (Is Part Of) |
All CO2 data contributed to WDCGG by GAW stations and mobiles by 2025-09-17 All CO2 data contributed to WDCGG by GAW stations and mobiles by 2024-09-24 All CO2 data contributed to WDCGG by GAW stations and mobiles by 2023-09-13 All CO2 data contributed to WDCGG by GAW stations and mobiles by 2022-09-07 All CO2 data contributed to WDCGG by GAW stations and mobiles by 2021-09-08 All CO2 data contributed to WDCGG by GAW stations and mobiles by 2020-09-28 All CO2 data contributed to WDCGG by GAW stations and mobiles by 2019-09-19 All CO2 data contributed to WDCGG by GAW stations and mobiles by 2018-10-25 |
||||
| Geolocation Point |
|
GAW Data Policy
"For Scientific purposes, access to these data is unlimited and provided without charge.
By their use you accept that an offer of co-authorship will be made through personal contact with the data providers
or owners whenever substantial use is made of their data.
In all cases, an acknowledgement must be made to the data providers or owners and to the data centre when these data are used within a publication."
Citation format
This format is an example of the WDCGG standard citation.
Please follow the citation format which the data providers or owners indicate.
Please follow the citation format which the data providers or owners indicate.
Xin Lan (NOAA),
Atmospheric CO2
at Samoa (Cape Matatula) by Global Monitoring Laboratory, NOAA,
dataset published as CO2_SMO5009_surface-insitu_NOAA_ccgg at WDCGG,
ver. 2025-08-21-1300 (Reference date*: YYYY/MM/DD)
* As the reference date, please indicate the date you downloaded the files.
* As the reference date, please indicate the date you downloaded the files.
Reference(s)
| 1 | K.W. Thoning, A.M. Crotwell, and J.W. Mund (2025), Atmospheric Carbon Dioxide Dry Air Mole Fractions from continuous measurements at Mauna Loa, Hawaii, Barrow, Alaska, American Samoa and South Pole, 1973-present. Version 2025-04-26, National Oceanic and Atmospheric Administration (NOAA), Global Monitoring Laboratory (GML), Boulder, Colorado, USA https://doi.org/10.15138/yaf1-bk21 |
|---|---|
| 2 | Halter, B.C., Harris, J.M., and Conway, T.J., Component signals in the record of atmospheric carbon dioxide concentration at American Samoa, J. Geophys. Res., 93, 15914 15918, 1988. |
| 3 | Waterman, L.S., D. W. Nelson, W.D. Komhyr, T.B. Harris, and K.W. Thoning, Atmospheric carbon dioxide measurements at Cape Matatula, American Samoa, 1976 1984., J. Geophys. Res., 94, 14817 14829, 1989 |


