Data Policy
GAW Data Policy
"For Scientific purposes, access to these data is unlimited and provided without charge.
By their use you accept that an offer of co-authorship will be made through personal contact with the data providers
or owners whenever substantial use is made of their data.
In all cases, an acknowledgement must be made to the data providers or owners and to the data centre when these data are used within a publication."
Version
2025-08-18-0705 (Last updated: 2025-08-21)File
This data set is submitted by NOAA.
In line with the GAW Data Policy, users should contact the contributors of all data of interest and propose co-authorship or acknowledgement.
Organization
| NO | 2 |
|---|---|
| Acronym | NOAA |
| Name | Global Monitoring Laboratory, NOAA |
| Address 1 | NOAA/ESRL |
| Address 2 | R/GML1 |
| Address 3 | 325 Broadway Boulder, CO 80305-3328 |
| Country/Territory | United States of America |
| Website | https://gml.noaa.gov/ |
Contact(s)
| Name | Xin Lan |
|---|---|
| Prefix | |
| xin.lan@noaa.gov | |
| Organization No | 2 |
| Organization acronym | NOAA |
| Organization name | Global Monitoring Laboratory, NOAA |
| Organization country/territory | United States of America |
| Address 1 | NOAA GML |
| Address 2 | 325 Broadway R/GML-1 |
| Address 3 | Boulder, CO 80305-3328 |
| Country/territory | United States of America |
| Tel | |
| Fax | |
| Last updated date | 2025-08-18 |
|
|||||||
| Background observation | |||||||
| UTC | |||||||
| ppm | |||||||
|
9999-12-31 00:00:00 - 9999-12-31 23:59:59: WMO CO2 X2019 |
|||||||
|
9999-12-31 00:00:00 - 9999-12-31 23:59:59: Unknown(NDIR) |
|||||||
| weekly | |||||||
|
UNCERTAINTIES Random Error We report CO2 measurement uncertainties that are based primarily on our ability to propagate the WMO XCO2 scale to working standards, the repeatability of the analyzers used for sample measurement, and the long-term reproducibility of analyzer responses. Zhao and Tans (2006) determined that the internal consistency of working standards is +/- 0.02 ppm (one sigma). The typical repeatability of the analyzers, based on repeated measurements of natural air from a high-pressure cylinder, is +/- 0.06 ppm for NDIR and +/- 0.02 ppm for CRDS. Long-term reproducibility is estimated to be +/- 0.03 ppm based on repeated measurements of air from a high-pressure cylinder, or the long-term variability in the differences between measurements of test flasks on the flask-air analysis system and separate measurements of the test gas used to fill the test flasks. Random errors (one sigma) have been estimated for all CO2 measurements and vary from 0.5 ppm for samples from 1967 to 0.04 ppm since 2019 with 65 % of all measurements having an uncertainty less than 0.1 ppm. . Uncertainty entries of -999.99 occur when uncertainties can not be calculated. Correction of Systematic Errors Based on comparison with in situ measurements at SPO (NOAA GML) and SYO (from National Institute of Polar Research, Japan), a storage correction was applied to some Antarctica flask-air samples measured for CO2. The correction is ~0.2 ppm/yr at SPO and 0.08 ppm/yr at SYO. Uncertainty for the correction has not yet been formally determined but has been estimated to be ~ 0.05 ppm. This estimate is not included in the reported measurement uncertainty. |
|||||||
|
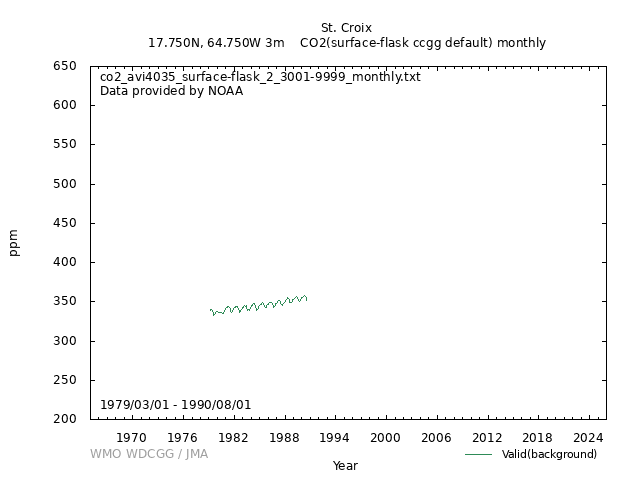
[Hourly] [Daily] [Monthly] Monthly means are produced for each site by first averaging all retained measurement results in the event file with a unique sample date and time. Values are then extracted at weekly intervals from a smooth curve (Thoning et al., 1989) fitted to the averaged data and these weekly values are averaged for each month to give the monthly means recorded in the files. Flagged data are excluded from the curve fitting process. Some sites are excluded from the monthly mean directory because sparse data or a short record does not allow a reasonable curve fit. Also, if there are 3 or more consecutive months without data, monthly means are not calculated for these months. |
|||||||
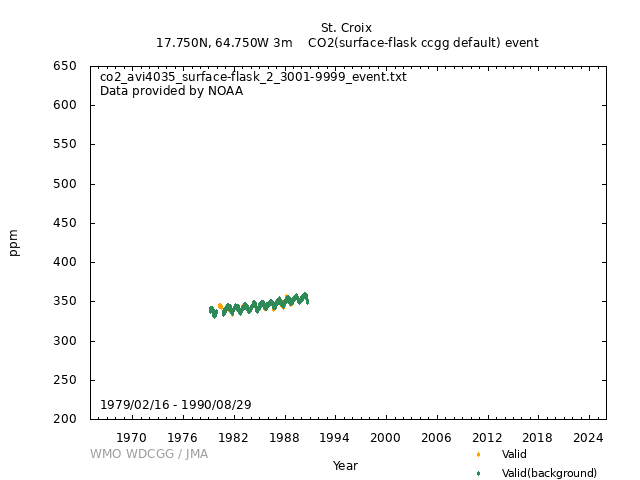
| This is the NOAA 3-character quality control flag. Column 1 is the REJECTION flag. An alphanumeric other than a period (.) in the FIRST column indicates a sample with obvious problems during collection or analysis. This measurement should not be interpreted. Column 2 is the SELECTION flag. An alphanumeric other than a period (.) in the SECOND column indicates a sample that is likely valid but does not meet selection criteria determined by the goals of a particular investigation. For example, it might not have been obtained during 'background' conditions. Column 3 is the INFORMATION flag. An alphanumeric other than a period (.) in the THIRD column provides additional information about the collection or analysis of the sample. A P in the 3rd column of the QC flag indicates the measurement result is preliminary and has not yet been carefully examined by the PI. The P flag is removed once the quality of the measurement has been determined. | |||||||
|
Valid (background): ... Valid (background): ..? Valid: .?? Invalid: ??? |
|||||||
| Operational/Reporting | |||||||
|
Atmospheric Carbon Dioxide Dry Air Mole Fractions from the NOAA GML Global Greenhouse Gas Reference Network, Carbon Cycle Cooperative Global Air Sampling Network: 1967 - Present These data are provided by NOAA. Principal investigators include Xin Lan (NOAA). Key partners include Fairleigh Dickinson University (FDU). Please cite the product's citation when using data from this dataset : Lan, X., G. Petron, K. Baugh, A.M. Crotwell, M.J. Crotwell, S. DeVogel, M. Madronich, J. Mauss, T. Mefford, E. Moglia, S. Morris, J.W. Mund, A. Searle, K.W. Thoning, S. Wolter and J. Miller (2025), Atmospheric Carbon Dioxide Dry Air Mole Fractions from the NOAA GML Global Greenhouse Gas Reference Network, Carbon Cycle Cooperative Global Air Sampling Network: 1967 - Present, Version: 2025-08-15, https://doi.org/10.15138/wkgj-f215 |
|||||||
|
Wind direction: Wind speed: Relative humidity: Precipitation amount: Air pressure: Air temperature: Dew point temperature: Sea water temperature: Sea surface water temperature: Sea water salinity: Sea surface water salinity: |
|||||||
|
Meteorological data may remain as first provided, even when greenhouse gas data are updated. |
DOI Metadata
| DOI |
|
||||||||
|---|---|---|---|---|---|---|---|---|---|
| For more information, please refer: doi.org/10.15138/wkgj-f215 | |||||||||
Related information
GAW Data Policy
"For Scientific purposes, access to these data is unlimited and provided without charge.
By their use you accept that an offer of co-authorship will be made through personal contact with the data providers
or owners whenever substantial use is made of their data.
In all cases, an acknowledgement must be made to the data providers or owners and to the data centre when these data are used within a publication."
Citation format
This format is an example of the WDCGG standard citation.
Please follow the citation format which the data providers or owners indicate.
Please follow the citation format which the data providers or owners indicate.
Xin Lan (NOAA),
Atmospheric CO2
at St. Croix by Global Monitoring Laboratory, NOAA,
dataset published as CO2_AVI4035_surface-flask_NOAA_ccgg at WDCGG,
ver. 2025-08-18-0705 (Reference date*: YYYY/MM/DD)
* As the reference date, please indicate the date you downloaded the files.
* As the reference date, please indicate the date you downloaded the files.
Reference(s)
| 1 | Lan, X., G. Petron, K. Baugh, A.M. Crotwell, M.J. Crotwell, S. DeVogel, M. Madronich, J. Mauss, T. Mefford, E. Moglia, S. Morris, J.W. Mund, A. Searle, K.W. Thoning, S. Wolter and J. Miller (2025), Atmospheric Carbon Dioxide Dry Air Mole Fractions from the NOAA GML Global Greenhouse Gas Reference Network, Carbon Cycle Cooperative Global Air Sampling Network: 1967 - Present, Version: 2025-08-15, https://doi.org/10.15138/wkgj-f215 |
|---|---|
| 2 | Conway, T.J., P.P. Tans, L.S. Waterman, K.W. Thoning, D.R. Kitzis, K.A. Masarie, and N. Zhang, Evidence for interannual variability of the carbon cycle from the NOAA/GMD global air sampling network, J. Geophys. Res.,99,22831 22855, 1994. |


