Data Policy
GAW Data Policy
"For Scientific purposes, access to these data is unlimited and provided without charge.
By their use you accept that an offer of co-authorship will be made through personal contact with the data providers
or owners whenever substantial use is made of their data.
In all cases, an acknowledgement must be made to the data providers or owners and to the data centre when these data are used within a publication."
Version
2025-01-01-0002 (Last updated: 2024-12-25)File
This data set is submitted by NOAA.
In line with the GAW Data Policy, users should contact the contributors of all data of interest and propose co-authorship or acknowledgement.
Organization
| NO | 2 |
|---|---|
| Acronym | NOAA |
| Name | Global Monitoring Laboratory, NOAA |
| Address 1 | NOAA/ESRL |
| Address 2 | R/GML1 |
| Address 3 | 325 Broadway Boulder, CO 80305-3328 |
| Country/Territory | United States of America |
| Website | https://gml.noaa.gov/ |
Contact(s)
| Name | Jocelyn Turnbull |
|---|---|
| Prefix | Dr |
| j.turnbull@gns.cri.nz | |
| Organization No | 120 |
| Organization acronym | GNS |
| Organization name | GNS Science |
| Organization country/territory | New Zealand |
| Address 1 | 30 Gracefield Road |
| Address 2 | Gracefield 5010 |
| Address 3 | New Zealand |
| Country/territory | New Zealand |
| Tel | 045701444 |
| Fax | |
| Last updated date | 2025-07-03 |
| Name | Scott Lehman |
|---|---|
| Prefix | |
| Scott.Lehman@colorado.edu | |
| Organization No | 34 |
| Organization acronym | INSTAAR |
| Organization name | Institute of Arctic and Alpine Research, University of Colorado |
| Organization country/territory | United States of America |
| Address 1 | University of Colorado at Boulder |
| Address 2 | 1560 30th St |
| Address 3 | Boulder, CO 80309-0450 |
| Country/territory | United States of America |
| Tel | |
| Fax | |
| Last updated date | 2018-04-09 |
| Background observation | |
| UTC | |
| permil | |
|
9999-12-31 00:00:00 - 9999-12-31 23:59:59: Unknown(Mass spectrometry) |
|
| weekly | |
|
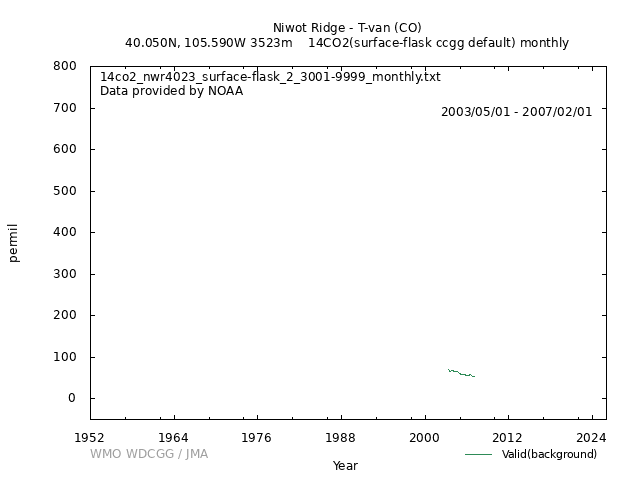
[Hourly] [Daily] [Monthly] Monthly means are produced for each site by first averaging all valid measurement results in the event file with a unique sample date and time. Values are then extracted at weekly intervals from a smooth curve (Thoning et al., 1989) fitted to the averaged data and these weekly values are averaged for each month to give the monthly means recorded in the files. Flagged data are excluded from the curve fitting process. Some sites are excluded from the monthly mean directory because sparse data or a short record does not allow a reasonable curve fit. Also, if there are 3 or more consecutive months without data, monthly means are not calculated for these months. |
|
|
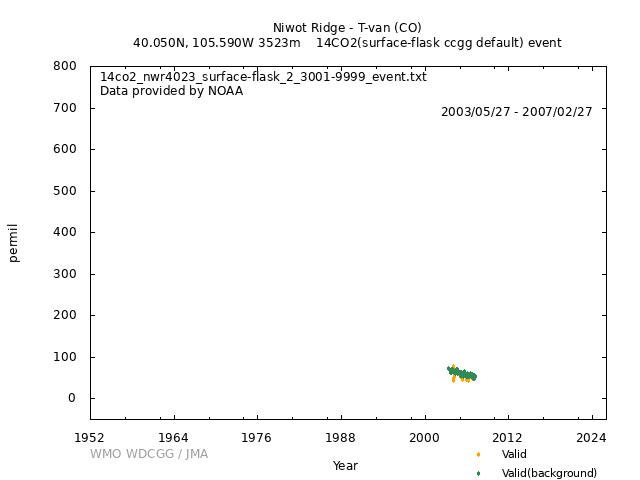
NOAA ESRL uses a 3-column quality control flag where each column is defined as follows: column 1 REJECTION flag. An alphanumeric other than a period (.) in the FIRST column indicates a sample with obvious problems during collection or analysis. This measurement should not be interpreted. column 2 SELECTION flag. An alphanumeric other than a period (.) in the SECOND column indicates a sample that is likely valid but does not meet selection criteria determined by the goals of a particular investigation. column 3 COMMENT flag. An alphanumeric other than a period (.) in the THIRD column provides additional information about the collection or analysis of the sample. WARNING: A "P" in the 3rd column of the QC flag indicates the measurement result is preliminary and has not yet been carefully examined by the PI. The "P" flag is removed once the quality of the measurement has been determined. If both the first and second column contain a period (e.g., "..." and "..I"), the sample is RETAINED. At surface sites, 14CO2 measurements are typically obtained by combining the air from two flasks collected simultaneously. Thus at most sites, only a single 14CO2 measurement is made for each sampling date. However, for consistency with other NOAA/ESRL CCGG datasets, a 14CO2 result is reported for every flask measured, such that the same measurement may be replicated in the result list. We include a flag in the third column when multiple flasks were combined, and the set of flasks combined can be identified by the CURL number listed in the comments field. This CURL number identifies the unique AMS 14C measurement. At some sites, four flasks are collected on some sampling dates, with first one pair of flasks collected simultaneously, immediately followed by collection of a second simultaneous pair. In this case, authentic replicate measurements are available (with differing CURL numbers). For surface site time series, selection flags in the second column are automatically determined by use of CO measurements obtained in the same flasks. Samples in which the CO measurement is more than 15 ppb from the fitted seasonal cycle for that site are automatically flagged .F. In addition, manually flagged samples are indicated by .Z. Flag Description RETAINED ... Retained, no comments. ..M Multiple flasks were combined to obtain this measurement; retained ..I sample has also been measured by another lab as part of an intercomparison experiment SELECTED .F. automatically flagged as non-background .Z. flagged manually as non-background REJECTED C.. rejected due to error in CO2 mixing ratio analysis A.. rejected due to error in CO2C14 analysis T.. sample collected as part of a methods test; not used in data analysis The retained values comprise the data set that we feel best represents the 14CO2 distribution in the remote, well-mixed global troposphere. These are the values we use to calculate long-term trends and interannual and seasonal variations in our studies of the global carbon cycle. It is possible, and even likely, that the values flagged as not representative of background conditions are valid measurements, but represent poorly mixed air masses influenced by local or regional anthropogenic sources or strong local biospheric sources or sinks. Users of these data should be aware that data selection is a difficult but necessary aspect of the analysis and interpretation of atmospheric trace gas data sets, and the specific data selection scheme used may be determined by the goals of a particular investigation. |
|
| Temporarily suspended | |
|
Wind direction: Wind speed: Relative humidity: Precipitation amount: Air pressure: Air temperature: Dew point temperature: Sea water temperature: Sea surface water temperature: Sea water salinity: Sea surface water salinity: |
|
|
Meteorological data may remain as first provided, even when greenhouse gas data are updated. |
No DOI available
Related information
| Format | Text (WDCGG Data Format Table, WDCGG Meteorological Data Format Table), NetCDF | ||||
|---|---|---|---|---|---|
| Relation List (Is Part Of) |
All 14CO2 data contributed to WDCGG by GAW stations and mobiles by 2025-07-22 All 14CO2 data contributed to WDCGG by GAW stations and mobiles by 2022-07-11 All 14CO2 data contributed to WDCGG by GAW stations and mobiles by 2020-12-18 All 14CO2 data contributed to WDCGG by GAW stations and mobiles by 2019-09-03 All 14CO2 data contributed to WDCGG by GAW stations and mobiles by 2018-06-26 |
||||
| Geolocation Point |
|
GAW Data Policy
"For Scientific purposes, access to these data is unlimited and provided without charge.
By their use you accept that an offer of co-authorship will be made through personal contact with the data providers
or owners whenever substantial use is made of their data.
In all cases, an acknowledgement must be made to the data providers or owners and to the data centre when these data are used within a publication."
Citation format
This format is an example of the WDCGG standard citation.
Please follow the citation format which the data providers or owners indicate.
Please follow the citation format which the data providers or owners indicate.
Jocelyn Turnbull (GNS),
Scott Lehman (INSTAAR),
Atmospheric 14CO2
at Niwot Ridge - T-van (CO) by Global Monitoring Laboratory, NOAA,
dataset published as 14CO2_NWR4023_surface-flask_NOAA_ccgg at WDCGG,
ver. 2025-01-01-0002 (Reference date*: YYYY/MM/DD)
* As the reference date, please indicate the date you downloaded the files.
* As the reference date, please indicate the date you downloaded the files.
Reference(s)
| 1 | Stuiver, M., and Polach, H. A.: Discussion: Reporting of 14C data, Radiocarbon, 19, 355-363, 1977. |
|---|---|
| 2 | Donahue, D. J., Linick, T., and Jull, A. T.: Isotope-ratio and background corrections for accelerator mass spectrometry radiocarbon measurements, Radiocarbon, 32, 135-142, 1990. |
| 3 | Turnbull, J. C., Miller, J. B., Lehman, S. J., Tans, P. P., Sparks, R. J., and Southon, J. R.: Comparison of 14CO2, CO and SF6 as tracers for determination of recently added fossil fuel CO2 in the atmosphere and implications for biological CO2 exchange, Geophysical Research Letters, 33, L01817, 2006. |
| 4 | Turnbull, J. C., Lehman, S. J., Miller, J. B., Sparks, R. J., Southon, J. R., and Tans, P. P.: A new high precision 14CO2 time series for North American continental air, Journal of Geophysical Research, 112, D11310, doi:10.1029/2006JD008184, 2007. |
| 5 | Turnbull, J. C., Miller, J. B., Lehman, S. J., Hurst, D. F., Peters, W., Tans, P. P., Southon, J. R., Montzka, S. A., Elkins, J. W., Mondeel, D. J., Romashkin, P. A., Elansky, N. F., and Shkorokhod, A.: Spatial distribution of D14CO2 across Eurasia: Measurements from the TROICA-8 expedition, Atmospheric Chemistry and Physics Discussions, 2008. |


