Data Policy
GAW Data Policy
"For Scientific purposes, access to these data is unlimited and provided without charge.
By their use you accept that an offer of co-authorship will be made through personal contact with the data providers
or owners whenever substantial use is made of their data.
In all cases, an acknowledgement must be made to the data providers or owners and to the data centre when these data are used within a publication."
Version
2025-08-21-1301 (Last updated: 2025-08-29)File
This data set is submitted by NOAA.
In line with the GAW Data Policy, users should contact the contributors of all data of interest and propose co-authorship or acknowledgement.
Organization
| NO | 2 |
|---|---|
| Acronym | NOAA |
| Name | Global Monitoring Laboratory, NOAA |
| Address 1 | NOAA/ESRL |
| Address 2 | R/GML1 |
| Address 3 | 325 Broadway Boulder, CO 80305-3328 |
| Country/Territory | United States of America |
| Website | https://gml.noaa.gov/ |
Contact(s)
| Name | Sylvia Michel |
|---|---|
| Prefix | |
| sylvia.michel@colorado.edu | |
| Organization No | 34 |
| Organization acronym | INSTAAR |
| Organization name | Institute of Arctic and Alpine Research, University of Colorado |
| Organization country/territory | United States of America |
| Address 1 | Institute of Arctic and Alpine Research |
| Address 2 | Campus Box 450 |
| Address 3 | University of Colorado, Boulder, CO 80309-0450 |
| Country/territory | United States of America |
| Tel | (303)735-5850 |
| Fax | (303) 492-6388 |
| Last updated date | 2023-10-02 |
| Name | Reid Clark |
|---|---|
| Prefix | |
| Justin.Reid.Clark@colorado.edu | |
| Organization No | 34 |
| Organization acronym | INSTAAR |
| Organization name | Institute of Arctic and Alpine Research, University of Colorado |
| Organization country/territory | United States of America |
| Address 1 | Institute of Arctic and Alpine Research |
| Address 2 | Campus Box 450 |
| Address 3 | University of Colorado, Boulder, CO 80309-0450 |
| Country/territory | United States of America |
| Tel | (303) 492-5495 |
| Fax | (303) 492-6388 |
| Last updated date | 2023-10-02 |
|
|||||||||||||||||||||||||||
| Background observation | |||||||||||||||||||||||||||
| UTC | |||||||||||||||||||||||||||
| permil | |||||||||||||||||||||||||||
|
9999-12-31 00:00:00 - 9999-12-31 23:59:59: VPDB |
|||||||||||||||||||||||||||
|
9999-12-31 00:00:00 - 9999-12-31 23:59:59: Unknown(Mass spectrometry) |
|||||||||||||||||||||||||||
| weekly | |||||||||||||||||||||||||||
|
Isotope data are reported as isotope delta values: the ratio of minor to major isotopes relative to a standard. The 'isotope delta' notation is d13C(CH4) = [ (13C/12C)sam / (13C/12C)std - 1 ] and is customarily expressed as a multiple of 1000 in units of 'permil'. The scale for carbon isotopes is the VPDB scale and is realized through calcite reference materials. Our local realization of the VPDB scale is through to Dr. Stan Tyler's lab at the University of California Irvine. He measured d13C-CH4 of methane in air relative to CO2 produced by reaction of NBS-19. All of the samples have been analyzed at the Stable Isotope Laboratory at CU-INSTAAR in Boulder, Colorado, using either a Micromass Optima or Elementar Isoprime isotope-ratio mass spectrometer coupled to a methane a custom-built trapping system, a gas chromatograph, and a combustion furnace. Measurement precision is approximately 0.06 permil for 13C (where 'precision' is taken as the long term reproducibility of a surveillance cylinder of ambient air. Current efforts to validate this scale and compare with other labs in the isotopic community are ongoing. For more information regarding calibrations of methane-in-air isotopes, see the recent review by Umezawa et al., 2017. |
|||||||||||||||||||||||||||
|
In 2013 we added a metric of uncertainty for isotopes of methane. This is not a "true" calculation of uncertainty in a metrological sense - instead it is a metric of short- to medium-term reproducibility of a surveillance cylinder. This air cylinder is well characterized by long-term measurement, and in addition to tracking our ties to VPDB over the long term, it alerts us to any problems with the mass spectrometer or extraction system. We use the standard deviation of ten runs' worth of surveillance cylinder measurements as the uncertainty metric. Usually four samples are run a day, of which all but the first are used (due to known irregularities caused by the tank regulator). For each run, the uncertainty is calculated from data from that run, regardless of its flagging, and the previous nine runs of unflagged data. (For example, if the current run is flagged, that surveillance cylinder data will be used in the uncertainty calculation; however, the next day's run will not use the flagged data in its uncertainty calculation.) As of Dec 2013, uncertainty is calculated with each run, and has been back-calculated to 2006. In May 2017, a post combustion column was added to remove doubly-charged Kr ions which interferes with measurement of the different masses of CH4-derived CO2. Extensive tests of cylinders with different CH4/Kr ratios before and after implementation of the PC column show that there is very little effect of Krypton on samples with methane mole fraction over 1400 ppb. A data correction has been applied for all 2018-2020 data to reduce a positive bias introduced by our sample preparation system. During this time there was a clog in a valve that caused reduced flow through our methane trapping system, causing smaller sample peaks in our analyzer, especially in low-pressure flasks. The difference in peak heights between samples and standards exacerbated an "amount effect" problem, where the peak height influenced the measured isotope delta value. With ongoing extensive testing that began in 2019, we discovered that our amount effect was variable, with an average of -0.019 permil/nA and a standard deviation of 0.047 permil/nA. To correct for it, we applied a Monte Carlo approach: we applied 100 randomly-chosen slopes from the list of measured corrections and calculated the mean of the corrected values. The standard deviation of the 100 iterations were added in quadrature to the analytical uncertainty to account for the error in the correction. Data for which the amount effect correction has been applied has a third position 'r'. A third position 'R' flag was added where the sample peak height differs from the standard peak height by more than 2.5 nA, where the correction was significant. This correction is imperfect, but does reduce a positive bias in the data suggested by intercomparisons with other research groups. If further evidence suggests a better way to handle this effect, we may revisit the correction for this time period. Evidence suggests that the amount effect comes from the combustion process, though investigations continue. In late-2020, the obstruction in the system was resolved and we now reliably control for peak size across sample types; therefore the amount effect is now within measurement noise. |
|||||||||||||||||||||||||||
|
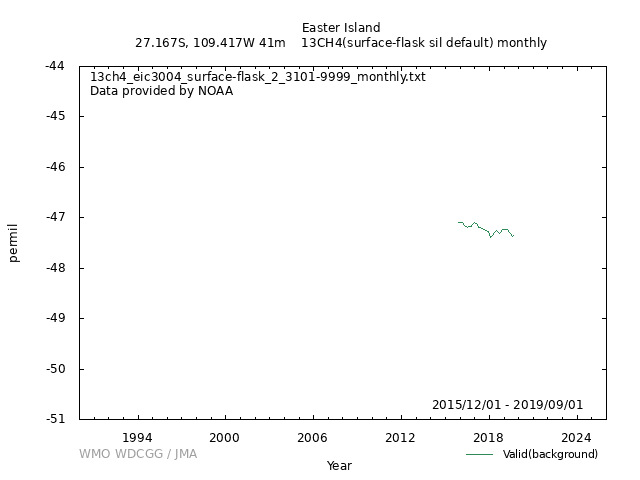
[Hourly] [Daily] [Monthly] Monthly means are produced for each site by first averaging all valid measurement results in the event file with a unique sample date and time. Values are then extracted at weekly intervals from a smooth curve (Thoning et al., 1989) fitted to the averaged data and these weekly values are averaged for each month to give the monthly means recorded in the files. Flagged data are excluded from the curve fitting process. Some sites are excluded from the monthly mean directory because sparse data or a short record does not allow a reasonable curve fit. Also, if there are 3 or more consecutive months without data, monthly means are not calculated for these months. |
|||||||||||||||||||||||||||
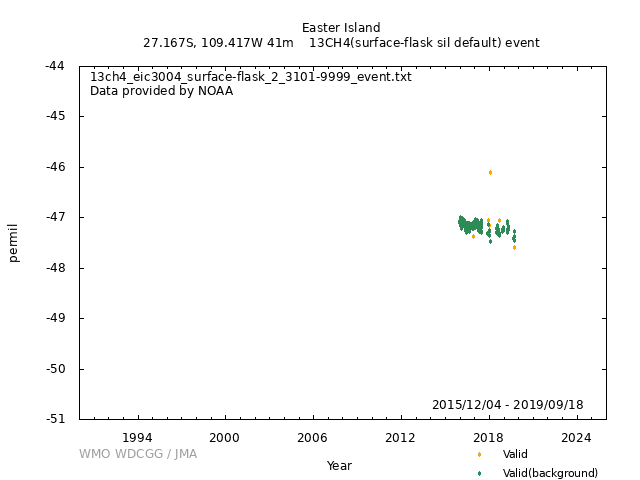
| This is the NOAA 3-character quality control flag. Column 1 is the REJECTION flag. An alphanumeric other than a period (.) in the FIRST column indicates a sample with obvious problems during collection or analysis. This measurement should not be interpreted. Column 2 is the SELECTION flag. An alphanumeric other than a period (.) in the SECOND column indicates a sample that is likely valid but does not meet selection criteria determined by the goals of a particular investigation. For example, it might not have been obtained during 'background' conditions. Column 3 is the INFORMATION flag. An alphanumeric other than a period (.) in the THIRD column provides additional information about the collection or analysis of the sample. A P in the 3rd column of the QC flag indicates the measurement result is preliminary and has not yet been carefully examined by the PI. The P flag is removed once the quality of the measurement has been determined. | |||||||||||||||||||||||||||
|
Valid (background): ... Valid (background): ..? Valid: .?? Invalid: ??? |
|||||||||||||||||||||||||||
| Operational/Reporting | |||||||||||||||||||||||||||
|
Stable Isotopic Composition of Atmospheric Methane (13C) from the NOAA GML Carbon Cycle Cooperative Global Air Sampling Network, 1998-2022. These data are provided by INSTAAR-SIL AND NOAA. Principal investigators include Sylvia Englund Michel (INSTAAR-SIL) AND Reid Clark (INSTAAR-SIL) AND Bruce Vaughn (INSTAAR-SIL). Key partners include Alonso Gaete (DMC). Please cite the product's citation when using data from this dataset : Michel, S.E., Clark, J.R., Vaughn, B.H., Crotwell, M., Madronich, M., Moglia, E., Neff, D., Mund, J. (2023), University of Colorado, Institute of Arctic and Alpine Research (INSTAAR). Stable Isotopic Composition of Atmospheric Methane (13C) from the NOAA GML Carbon Cycle Cooperative Global Air Sampling Network, 1998-2022 Version: 2023-09-21 https://doi.org/10.15138/9p89-1x02 |
|||||||||||||||||||||||||||
|
Wind direction: Wind speed: Relative humidity: Precipitation amount: Air pressure: Air temperature: Dew point temperature: Sea water temperature: Sea surface water temperature: Sea water salinity: Sea surface water salinity: |
|||||||||||||||||||||||||||
|
Meteorological data may remain as first provided, even when greenhouse gas data are updated. |
DOI Metadata
| DOI |
|
||||||||
|---|---|---|---|---|---|---|---|---|---|
| For more information, please refer: doi.org/10.15138/9p89-1x02 | |||||||||
Related information
| Format | Text (WDCGG Data Format Table, WDCGG Meteorological Data Format Table), NetCDF | ||||
|---|---|---|---|---|---|
| Relation List (Is Part Of) |
All 13CH4 data contributed to WDCGG by GAW stations and mobiles by 2025-09-10 All 13CH4 data contributed to WDCGG by GAW stations and mobiles by 2024-07-01 All 13CH4 data contributed to WDCGG by GAW stations and mobiles by 2023-07-20 |
||||
| Geolocation Point |
|
GAW Data Policy
"For Scientific purposes, access to these data is unlimited and provided without charge.
By their use you accept that an offer of co-authorship will be made through personal contact with the data providers
or owners whenever substantial use is made of their data.
In all cases, an acknowledgement must be made to the data providers or owners and to the data centre when these data are used within a publication."
Citation format
This format is an example of the WDCGG standard citation.
Please follow the citation format which the data providers or owners indicate.
Please follow the citation format which the data providers or owners indicate.
Sylvia Michel (INSTAAR),
Reid Clark (INSTAAR),
Atmospheric 13CH4
at Easter Island by Global Monitoring Laboratory, NOAA,
dataset published as 13CH4_EIC3004_surface-flask_NOAA_sil at WDCGG,
ver. 2025-08-21-1301 (Reference date*: YYYY/MM/DD)
* As the reference date, please indicate the date you downloaded the files.
* As the reference date, please indicate the date you downloaded the files.
Reference(s)
| 1 | Michel, S.E., Clark, J.R., Vaughn, B.H., Crotwell, M., Madronich, M., Moglia, E., Neff, D., Mund, J. (2023), University of Colorado, Institute of Arctic and Alpine Research (INSTAAR). Stable Isotopic Composition of Atmospheric Methane (13C) from the NOAA GML Carbon Cycle Cooperative Global Air Sampling Network, 1998-2022 Version: 2023-09-21 https://doi.org/10.15138/9p89-1x02 |
|---|


