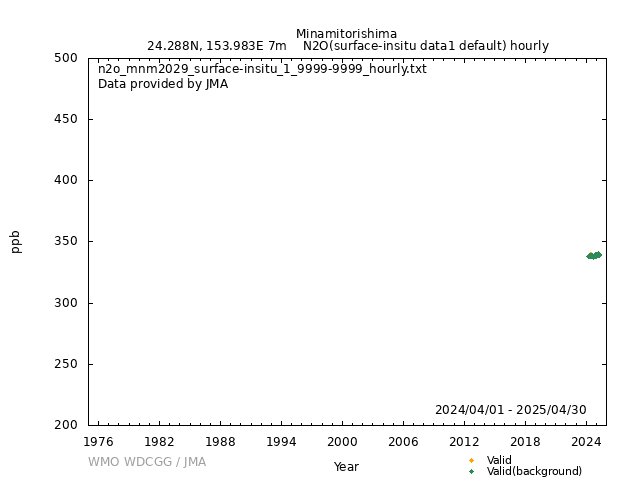
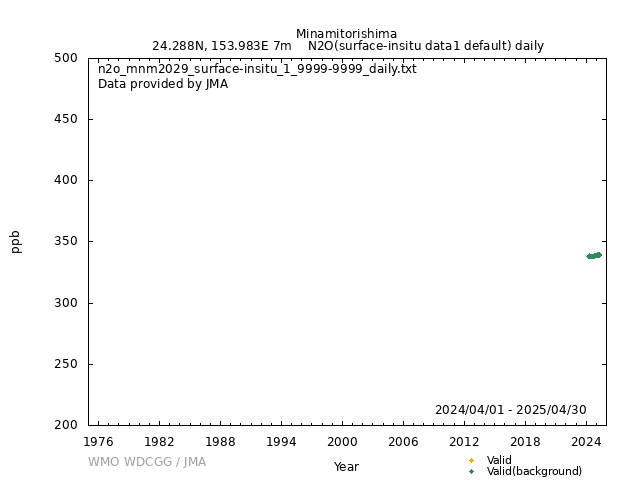
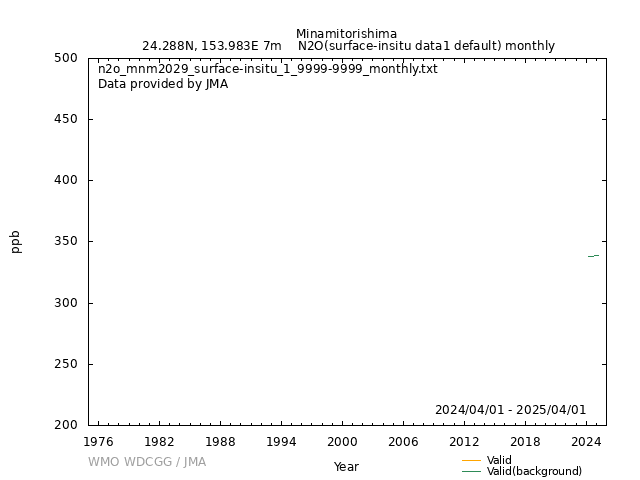
Data Policy
GAW Data Policy
"For Scientific purposes, access to these data is unlimited and provided without charge.
By their use you accept that an offer of co-authorship will be made through personal contact with the data providers
or owners whenever substantial use is made of their data.
In all cases, an acknowledgement must be made to the data providers or owners and to the data centre when these data are used within a publication."
Version
2025-12-26-0151 (Last updated: 2026-01-06)File
This data set is submitted by JMA.
In line with the GAW Data Policy, users should contact the contributors of all data of interest and propose co-authorship or acknowledgement.
Organization
| NO | 1 |
|---|---|
| Acronym | JMA |
| Name | Japan Meteorological Agency |
| Address 1 | |
| Address 2 | |
| Address 3 | 3-6-9 Toranomon, Minato City, Tokyo 105-8431 |
| Country/Territory | Japan |
| Website | https://www.jma.go.jp/jma/indexe.html |
Contact(s)
| Name | TAKATSUJI Shinya |
|---|---|
| Prefix | Mr. |
| ghg_obs@met.kishou.go.jp | |
| Organization No | 1 |
| Organization acronym | JMA |
| Organization name | Japan Meteorological Agency |
| Organization country/territory | Japan |
| Address 1 | Atmosphere and Ocean Department |
| Address 2 | Atmospheric Environment and Ocean Division |
| Address 3 | 3-6-9 Toranomon, Minato City, Tokyo 105-8431 |
| Country/territory | Japan |
| Tel | +81-3-3434-9127 |
| Fax | |
| Last updated date | 2025-12-26 |
| Background observation | |
| UTC+09:00 | |
| ppb | |
|
2024-04-01 00:00:00 - 9999-12-31 23:59:59: WMO N2O X2006A |
|
|
2024-04-01 00:00:00 - 9999-12-31 23:59:59: Picarro, Inc. G5310(CRDS) |
|
|
2024-04-01 00:00:00 - 9999-12-31 23:59:59: 20 (m) |
|
| 30 seconds | |
|
Atmospheric concentrations are determined by calibration curves calculated before and after observation. The fitting curve is calculated every 8 hours by a set of 4 working standard gases of CO&N2O-in-natural air mixtures (Apr. 2024 – present). |
|
|
Raw data is recorded every 30 seconds (Apr. 2024 – present) . Local influences and anomalous data are removed by HQC. Atmospheric concentrations are calculated from raw data using calibration curves. |
|
|
[Hourly] Hourly data are arithmetic mean of concentrations after HQC. For the details of background hourly data, please refer to https://www.data.jma.go.jp/env/ghg_obs/JMA_flag.html [Daily] Daily data are arithmetic mean of background hourly data. For the details of background hourly data, please refer to https://www.data.jma.go.jp/env/ghg_obs/JMA_flag.html [Monthly] Monthly data are arithmetic mean of background hourly data. For the details of background hourly data, please refer to https://www.data.jma.go.jp/env/ghg_obs/JMA_flag.html |
|
|
Hourly data 0-6: no background condition 7: background condition 9: missing Daily and Monthly data 2: no valid hourly data 3: valid 9: missing The flag has a positive or negative value. The concentration with the flag of a negative number is provisional and the selection is the same. For the details, please refer to https://www.data.jma.go.jp/env/ghg_obs/JMA_flag.html |
|
| Operational/Reporting | |
|
[Sampling] Air samples are collected through an intake, and then de-dusted and dried. The flow rate is 100mL/min at the analyzer inlet. (Apr. 2024 – present). |
|
|
Wind direction: 1 Wind speed: 1 Relative humidity: 1 Precipitation amount: 1 Air pressure: 1 Air temperature: 1 Dew point temperature: 1 Sea water temperature: 0 Sea surface water temperature: 0 Sea water salinity: 0 Sea surface water salinity: 0 |
|
|
Meteorological data may remain as first provided, even when greenhouse gas data are updated. |
DOI Metadata
| DOI |
|
||||||||||||||||
|---|---|---|---|---|---|---|---|---|---|---|---|---|---|---|---|---|---|
| Version |
2025-12-26-0151 (Data Version History) * DOIs and file names may have multiple versions. Be sure to check the data version. |
||||||||||||||||
| Title | Atmospheric N2O at Minamitorishima by Japan Meteorological Agency, dataset published as N2O_MNM2029_surface-insitu_JMA_data1 at WDCGG | ||||||||||||||||
| Creator |
Japan Meteorological Agency TAKATSUJI Shinya (JMA) |
||||||||||||||||
| Publisher | World Data Centre for Greenhouse Gases | ||||||||||||||||
| Publication Date | 2025-07-08 (Last Updated: 2026-01-06) | ||||||||||||||||
| Format | Text (WDCGG Data Format Table, WDCGG Meteorological Data Format Table), NetCDF | ||||||||||||||||
| Relation List (Is Part Of) |
All N2O data contributed to WDCGG by GAW stations and mobiles by 2025-09-17 |
||||||||||||||||
| Geolocation Point |
|
GAW Data Policy
"For Scientific purposes, access to these data is unlimited and provided without charge.
By their use you accept that an offer of co-authorship will be made through personal contact with the data providers
or owners whenever substantial use is made of their data.
In all cases, an acknowledgement must be made to the data providers or owners and to the data centre when these data are used within a publication."
Citation format
This format is an example of the WDCGG standard citation.
Please follow the citation format which the data providers or owners indicate.
Please follow the citation format which the data providers or owners indicate.
TAKATSUJI Shinya (JMA),
Atmospheric N2O
at Minamitorishima by Japan Meteorological Agency,
dataset published as N2O_MNM2029_surface-insitu_JMA_data1 at WDCGG,
ver. 2025-12-26-0151, https://doi.org/10.50849/WDCGG_0001-2029-1003-01-01-9999 (Reference date*: YYYY/MM/DD)
* As the reference date, please indicate the date you downloaded the files.
* As the reference date, please indicate the date you downloaded the files.
Reference(s)
| 1 | JMA, Observation method of the greenhouse gas https://www.data.jma.go.jp/env/ghg_obs/en/ |
|---|


