Data Policy
GAW Data Policy
"For Scientific purposes, access to these data is unlimited and provided without charge.
By their use you accept that an offer of co-authorship will be made through personal contact with the data providers
or owners whenever substantial use is made of their data.
In all cases, an acknowledgement must be made to the data providers or owners and to the data centre when these data are used within a publication."
Version
2025-10-01-0129 (Last updated: 2025-10-21)File
This data set is submitted by JMA.
In line with the GAW Data Policy, users should contact the contributors of all data of interest and propose co-authorship or acknowledgement.
Organization
| NO | 1 |
|---|---|
| Acronym | JMA |
| Name | Japan Meteorological Agency |
| Address 1 | |
| Address 2 | |
| Address 3 | 3-6-9 Toranomon, Minato City, Tokyo 105-8431 |
| Country/Territory | Japan |
| Website | https://www.jma.go.jp/jma/indexe.html |
Contact(s)
| Name | TAKATSUJI Shinya |
|---|---|
| Prefix | Mr. |
| ghg_obs@met.kishou.go.jp | |
| Organization No | 1 |
| Organization acronym | JMA |
| Organization name | Japan Meteorological Agency |
| Organization country/territory | Japan |
| Address 1 | Atmosphere and Ocean Department |
| Address 2 | Atmospheric Environment and Ocean Division |
| Address 3 | 3-6-9 Toranomon, Minato City, Tokyo 105-8431 |
| Country/territory | Japan |
| Tel | +81-3-3434-9127 |
| Fax | |
| Last updated date | 2025-12-26 |
| Background observation | |
| UTC+09:00 | |
| ppb | |
|
1998-01-01 00:00:00 - 9999-12-31 23:59:59: WMO CH4 X2004A |
|
|
1998-01-01 00:00:00 - 2007-12-31 23:59:59: HORIBA, Ltd. GA-360S(NDIR) 2008-01-01 00:00:00 - 2024-03-31 23:59:59: Round Science Inc. RGC-1(Gas chromatography (FID)) |
|
|
1998-01-01 00:00:00 - 9999-12-31 23:59:59: 20 (m) |
|
| 10 minutes | |
| The quadratic fitting curve is determined every 8 hours by a set of 4 working standard gases of CH4-in-natural air mixtures in different concentrations. The mole fraction is determined by this fitting curve (Jan. 2008 - present). The linear fitting curve was determined every 12 hours by a set of 2 station working standard gases of CH4-in-natural air mixtures in different concentrations (Jan. 1998 - Dec. 2007). | |
| The raw data from instrument is collected by the data acquisition system, and stored in the system as every 10 minutes raw data (or 30 seconds mean data, Jan. 1998 - Dec. 2007). CH4 measurements are checked every day from the headquarters through the network every day. All irregular measurements and information are recorded in a log book. Finally, the measurement data are checked and validated by the contributor at the headquarters every month. | |
|
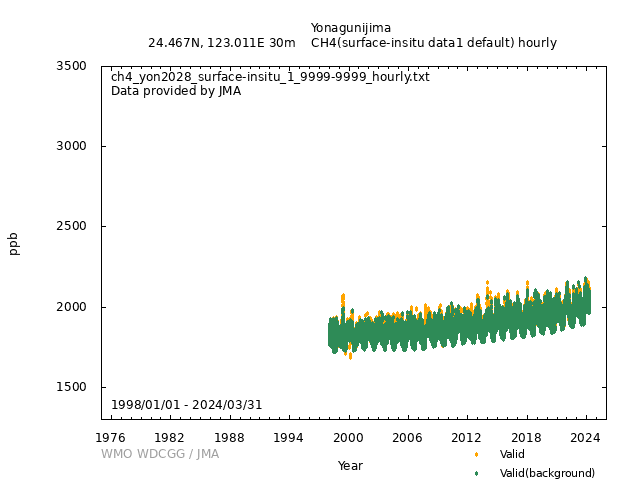
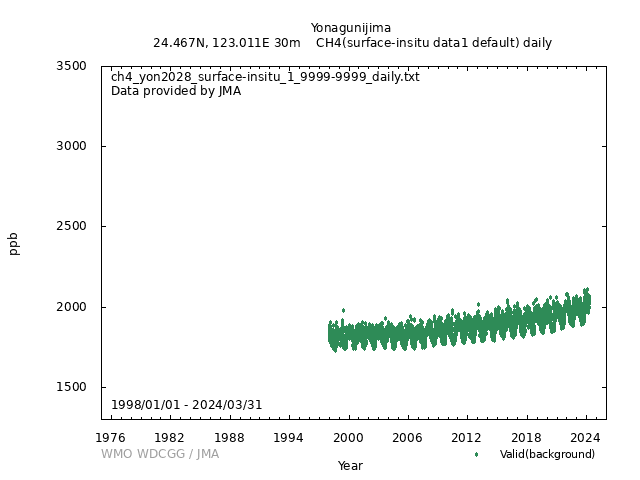
[Hourly] Hourly data are taken from the arithmetic mean of observed data for one hour after the irregular and evident error data are rejected. For the details of background hourly data, please refer to https://www.data.jma.go.jp/env/ghg_obs/JMA_flag.html [Daily] Daily data are taken from the arithmetic mean of background hourly data. For the details of background hourly data, please refer to https://www.data.jma.go.jp/env/ghg_obs/JMA_flag.html [Monthly] Monthly data are taken from the arithmetic mean of background hourly data. For the details of background hourly data, please refer to https://www.data.jma.go.jp/env/ghg_obs/JMA_flag.html |
|
|
Hourly data 0-6: no background condition 7: background condition 9: missing Daily and Monthly data 2: no valid hourly data 3: valid 9: missing The flag has a positive or negative value. The concentration with the flag of a negative number is provisional and the selection is the same. For the details, please refer to https://www.data.jma.go.jp/env/ghg_obs/JMA_flag.html |
|
| Terminated | |
|
[Sampling] Air samples are collected through an intake, and then de-dusted and dried. The flow rate is 250mL/min at the analyzer inlet. (Jan. 1998 – Mar. 2024). |
|
|
Wind direction: 1 Wind speed: 1 Relative humidity: 1 Precipitation amount: 1 Air pressure: 1 Air temperature: 1 Dew point temperature: 1 Sea water temperature: 0 Sea surface water temperature: 0 Sea water salinity: 0 Sea surface water salinity: 0 |
|
|
Meteorological data may remain as first provided, even when greenhouse gas data are updated. |
DOI Metadata
| DOI |
|
||||||||||||||||
|---|---|---|---|---|---|---|---|---|---|---|---|---|---|---|---|---|---|
| Version |
2025-10-01-0129 (Data Version History) * DOIs and file names may have multiple versions. Be sure to check the data version. |
||||||||||||||||
| Title | Atmospheric CH4 at Yonagunijima by Japan Meteorological Agency, dataset published as CH4_YON2028_surface-insitu_JMA_data1 at WDCGG | ||||||||||||||||
| Creator |
Japan Meteorological Agency TAKATSUJI Shinya (JMA) |
||||||||||||||||
| Publisher | World Data Centre for Greenhouse Gases | ||||||||||||||||
| Publication Date | 2016-12-20 (Last Updated: 2025-10-21) | ||||||||||||||||
| Format | Text (WDCGG Data Format Table, WDCGG Meteorological Data Format Table), NetCDF | ||||||||||||||||
| Relation List (Is Part Of) |
All CH4 data contributed to WDCGG by GAW stations and mobiles by 2025-09-16 All CH4 data contributed to WDCGG by GAW stations and mobiles by 2024-09-24 All CH4 data contributed to WDCGG by GAW stations and mobiles by 2023-09-13 All CH4 data contributed to WDCGG by GAW stations and mobiles by 2022-09-07 All CH4 data contributed to WDCGG by GAW stations and mobiles by 2021-08-27 All CH4 data contributed to WDCGG by GAW stations and mobiles by 2020-09-28 All CH4 data contributed to WDCGG by GAW stations and mobiles by 2019-09-19 All CH4 data contributed to WDCGG by GAW stations and mobiles by 2018-10-25 |
||||||||||||||||
| Geolocation Point |
|
GAW Data Policy
"For Scientific purposes, access to these data is unlimited and provided without charge.
By their use you accept that an offer of co-authorship will be made through personal contact with the data providers
or owners whenever substantial use is made of their data.
In all cases, an acknowledgement must be made to the data providers or owners and to the data centre when these data are used within a publication."
Citation format
This format is an example of the WDCGG standard citation.
Please follow the citation format which the data providers or owners indicate.
Please follow the citation format which the data providers or owners indicate.
TAKATSUJI Shinya (JMA),
Atmospheric CH4
at Yonagunijima by Japan Meteorological Agency,
dataset published as CH4_YON2028_surface-insitu_JMA_data1 at WDCGG,
ver. 2025-10-01-0129, https://doi.org/10.50849/WDCGG_0001-2028-1002-01-01-9999 (Reference date*: YYYY/MM/DD)
* As the reference date, please indicate the date you downloaded the files.
* As the reference date, please indicate the date you downloaded the files.
Reference(s)
| 1 | Matsueda, H. et al., Methane standard gases for atmospheric measurements at the MRI and JMA and intercomparison experiments, Papers in Meteorology and Geophysics, 54, 91-109, 2004 |
|---|---|
| 2 | Tsutsumi, Y., K. Mori, M. Ikegami, T. Tashiro, K. Tsuboi, (2006) Long-term trends of greenhouse gases in regional and background events observed during 1998-2004 at Yonagunijima located to the east of the Asian continent. Atmospheric Environment, 40, 5868-5879. |
| 3 | JMA, Observation method of the greenhouse gas https://www.data.jma.go.jp/env/ghg_obs/en/ |


